

Question: Double Horizontal scale. The graph in Figure 42 shows simultaneously the number of births in this country during two time periods: 19461964 and 19771994. When
Double Horizontal scale. The graph in Figure 42 shows simultaneously the number of births in this country during two time periods: 1946–1964 and 1977–1994. When did the first baby boom peak? When did the second baby boom peak? Why do you think the designer of this display chose to superimpose the two time intervals, rather than use a single time scale from 1946 through 1994?
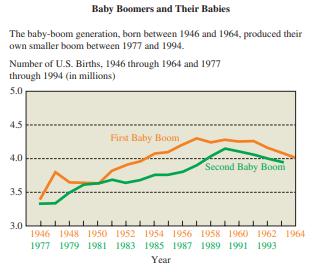
Baby Boomers and Their Babies The baby-boom generation, born between 1946 and 1964, produced their own smaller boom between 1977 and 1994. Number of U.S. Births, 1946 through 1964 and 1977 through 1994 (in millions) 5.0 4.5 First Baby Boom 4.0 Second Baby Boom 3.5 3.0 1946 1948 1950 1952 1954 1956 1958 1960 1962 1964 1977 1979 1981 1983 1985 1987 1989 1991 1993 Year
Step by Step Solution
There are 3 Steps involved in it

Get step-by-step solutions from verified subject matter experts