

Question: Entitlement spending. The stack plot in Figure 25 shows Congressional Budget Office data for actual (through 2011) and projected spending on entitlement programs through 2085
Entitlement spending. The stack plot in Figure 25 shows Congressional Budget Office data for actual (through 2011)
and projected spending on entitlement programs through 2085 as percentages of the gross domestic product (GDP).
Interpret the graph and summarize its message.
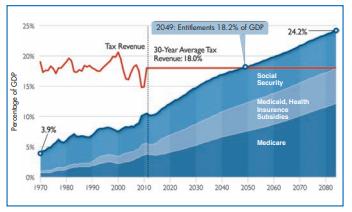
Percentage of GDP 25% 2049: Entifiements 18.2% of GDP 24.2% Tax Revenue 30-Year Average Tax Revenue: 18.0% Social Security 10% 5% 3.9% Medicaid, Health Subsidies Medicare ON 1970 1980 1990 2000 2010 2020 2030 2040 2050 2060 2070 2080
Step by Step Solution
There are 3 Steps involved in it
1 Expert Approved Answer
Step: 1 Unlock

Question Has Been Solved by an Expert!
Get step-by-step solutions from verified subject matter experts
Step: 2 Unlock
Step: 3 Unlock