

Question: The stack plot in Figure 3.24 on the next page shows Congressional Budget Office data for actual spending (through 2011) and projected spending on federal
The stack plot in Figure 3.24 on the next page shows Congressional Budget Office data for actual spending (through 2011) and projected spending on federal entitlement programs through 2085 as percentages of the gross domestic product (GDP). Interpret the graph and summarize its message.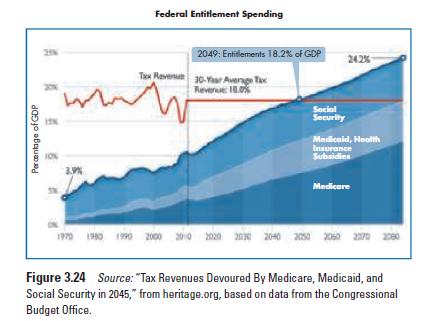
Federal Entitlement Spending Tax Revenue 30-Year Average Tax Revenue: 100% ww Social Security Medicaid, Health Insurance Subsidies 3.9% Medicare 1979 1980 1999 2000 2010 2020 2030 2040 2050 2060 2270 2090 Figure 3.24 Source: "Tax Revenues Devoured By Medicare, Medicaid, and Social Security in 2045," from heritage.org, based on data from the Congressional Budget Office. Percentage of GDP 2049: Entitlements 18.2% of GDP 24.2%
Step by Step Solution
3.42 Rating (165 Votes )
There are 3 Steps involved in it
As shown in the stack plot entitlement spending is projected to increase significantly as a p... View full answer

Get step-by-step solutions from verified subject matter experts