

Question: This problem involves computing the liquidvapor Pxy diagram from the two parameter Margulies model. In this model, the activity coefficients are given by and The
This problem involves computing the liquid–vapor P–x–y diagram from the two parameter Margulies model. In this model, the activity coefficients are given by![]()
and![]()
The parameters α and β are already in dimensionless form in units of RT and are restricted to have the values![]()
and![]()
For this problem, we will use A = 1 and B = 0.3. This is sufficiently non-ideal to exhibit an azeotrope but not so bad that you will also get liquid–liquid phase separation. Recall from thermodynamics that the equilibrium is given by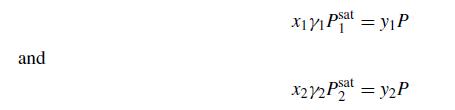
where we have assumed an ideal vapor phase. For this problem, let’s assume the saturation pressures are P1sat = 1100 mm Hg and P2sat = 800 mm Hg. The ultimate goal is to plot the P–x–y diagram, but we are going to lead you through the problem in steps to make it easier.
(a) The first step is to determine the location of the azeotrope because this is a turning point in the continuation method – we will need to construct solutions on the left and right of the azeotrope. Use you knowledge of thermodynamics to come up with a single equation that allows you to compute the azeotrope composition. Write a MATLAB program that computes both the value of xazeo and the corresponding pressure Pazeo. Report these values along with the function f and derivative f′ needed for Newton’s method.
(b) Write a MATLAB program that implements Newton–Raphson to compute the equilibrium compositions. It is easiest to do this with four unknowns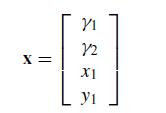
to avoid having to take very complicated derivatives.What is the residual vector and Jacobian needed for Newton–Raphson? Show that your answer from part (a) gives a very small value of ||R|| and compute the condition number of the Jacobian with the answer from part (a) using MATLAB’s function cond. What does this mean for implementing Newton–Raphson? You do not need to execute the while loop here if you can answer the previous question without an “experiment” – you can make it not execute by giving it a very loose tolerance value.
(c) Now write a MATLAB program that uses the results so far to make the P–x–y diagram. You already have a big hint; the azeotrope is a turning point so you will need to make the diagram in two pieces, one before the turning point and one after. Your program should produce the P–x–y diagram.
Iny = x + x
Step by Step Solution
3.40 Rating (156 Votes )
There are 3 Steps involved in it

Get step-by-step solutions from verified subject matter experts