

Question: Exercise 8.29 gives a scatterplot displaying the relationship between the percent of families that own their home and the percent of the population living in
Exercise 8.29 gives a scatterplot displaying the relationship between the percent of families that own their home and the percent of the population living in urban areas. Below is a similar scatterplot, excluding District of Columbia, as well as the residuals plot. There were 51 cases.
(a) For these data, R2 = 0:28. What is the correlation? How can you tell if it is positive or negative?
(b) Examine the residual plot. What do you observe? Is simple least squares fit appropriate for these data?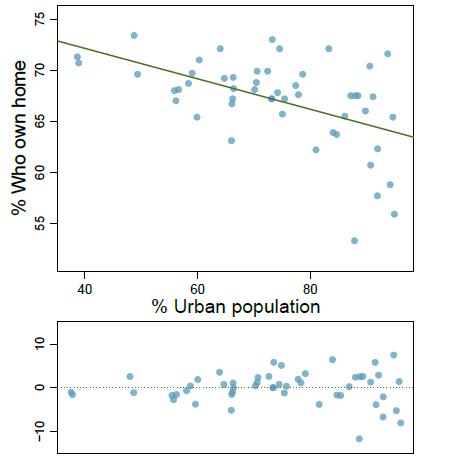
Data from Exercise 8.29
The scatterplot below shows the percent of families who own their home vs. the percent of the population living in urban areas. There are 52 observations, each corresponding to a state in the US. Puerto Rico and District of Columbia are also included.
-10 0 10 40 60 % Urban population 80 % Who own home 55 60 65 70 75
Step by Step Solution
3.59 Rating (152 Votes )
There are 3 Steps involved in it
Based on the scatter plot you sent it appears there is a weak positive correlation between the percent of families that own their home and the percent of the population living in urban areas A positiv... View full answer

Get step-by-step solutions from verified subject matter experts