

The Association of Turkish Travel Agencies reports the number of foreign tourists visiting Turkey and tourist spending
Question:
The Association of Turkish Travel Agencies reports the number of foreign tourists visiting Turkey and tourist spending by year. Three plots are provided: scatterplot showing the relationship between these two variables along with the least squares t, residuals plot, and histogram of residuals.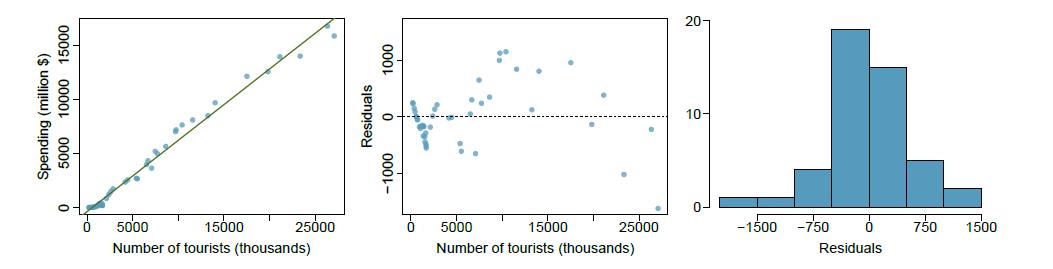
(a) Describe the relationship between number of tourists and spending.
(b) What are the explanatory and response variables?
(c) Why might we want to fit a regression line to these data?
(d) Do the data meet the conditions required for fitting a least squares line? In addition to the scatterplot, use the residual plot and histogram to answer this question.
Step by Step Answer:

This question has not been answered yet.
You can Ask your question!

OpenIntro Statistics
ISBN: 9781943450077
4th Edition
Authors: David Diez, Mine Çetinkaya-Rundel, Christopher Barr
