

Question: The scatterplot below shows the relationship between the number of calories and amount of carbohydrates (in grams) Starbucks food menu items contain. Since Starbucks only
The scatterplot below shows the relationship between the number of calories and amount of carbohydrates (in grams) Starbucks food menu items contain. Since Starbucks only lists the number of calories on the display items, we are interested in predicting the amount of carbs a menu item has based on its calorie content.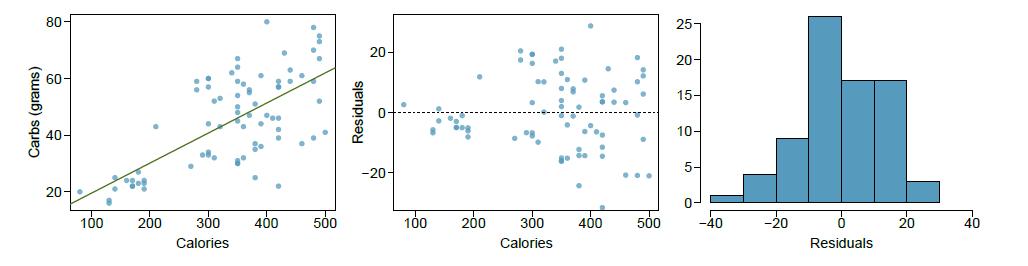
(a) Describe the relationship between number of calories and amount of carbohydrates (in grams) that Starbucks food menu items contain.
(b) In this scenario, what are the explanatory and response variables?
(c) Why might we want to t a regression line to these data?
(d) Do these data meet the conditions required for fitting a least squares line?
Carbs (grams) 80- 60- 40- 20- 100 200 300 Calories 400 500 Residuals 20- -20- g 100 200 300 Calories 400 500 25- 20- 15- 10- 5- 0- -40 -20 Residuals 20 40
Step by Step Solution
3.34 Rating (163 Votes )
There are 3 Steps involved in it
a In the scatterplot the relationship between the number of calories and the amount of carbohydrates appears to have a pattern of positive correlation ... View full answer

Get step-by-step solutions from verified subject matter experts