

Question: The bar plot and the pie chart below show the distribution of pre-existing medical conditions of children involved in a study on the optimal duration
The bar plot and the pie chart below show the distribution of pre-existing medical conditions of children involved in a study on the optimal duration of antibiotic use in treatment of tracheitis, which is an upper respiratory infection.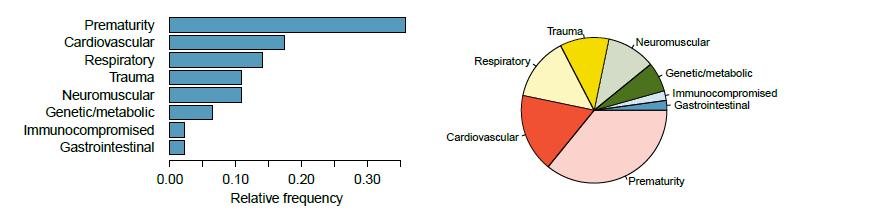
(a) What features are apparent in the bar plot but not in the pie chart?
(b) What features are apparent in the pie chart but not in the bar plot?
(c) Which graph would you prefer to use for displaying these categorical data?
Prematurity Cardiovascular Respiratory Trauma Neuromuscular Genetic/metabolic Immunocompromised Gastrointestinal 0.00 0.10 0.20 Relative frequency 0.30 Respiratory Cardiovascular Trauma Neuromuscular Genetic/metabolic Immunocompromised Gastrointestinal Prematurity
Step by Step Solution
3.40 Rating (166 Votes )
There are 3 Steps involved in it

Get step-by-step solutions from verified subject matter experts