

The US census collects data on race and ethnicity of Americans, among many other variables. The histogram
Question:
The US census collects data on race and ethnicity of Americans, among many other variables. The histogram below shows the distribution of the percentage of the population that is Hispanic in 3,142 counties in the US in 2010. Also shown is a histogram of logs of these values.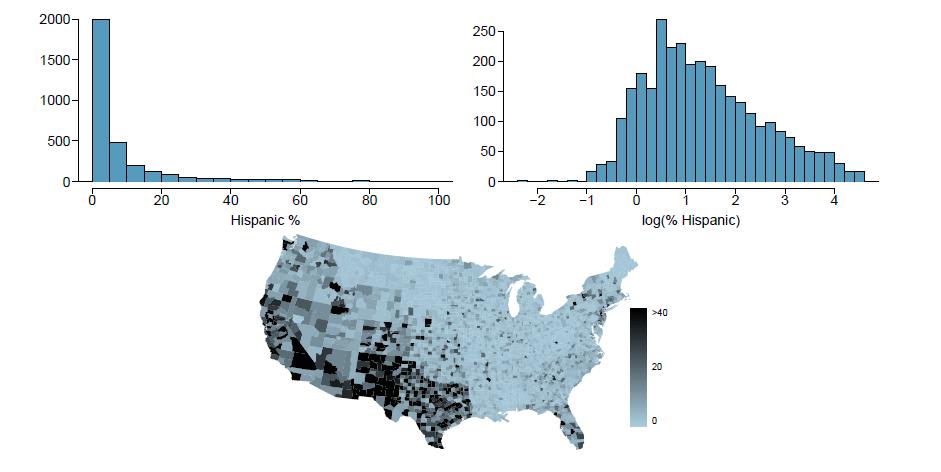
(a) Describe the numerical distribution and comment on why we might want to use log-transformed values in analyzing or modeling these data.
(b) What features of the distribution of the Hispanic population in US counties are apparent in the map but not in the histogram? What features are apparent in the histogram but not the map?
(c) Is one visualization more appropriate or helpful than the other? Explain your reasoning.
Step by Step Answer:
a Description of the numerical distribution The histogram of the raw percentage of Hispanic population shows a highly skewed distribution with a large ...View the full answer


OpenIntro Statistics
ISBN: 9781943450077
4th Edition
Authors: David Diez, Mine Çetinkaya-Rundel, Christopher Barr
