

The histogram and box plots below show the distribution of finishing times for male and female winners
Question:
The histogram and box plots below show the distribution of finishing times for male and female winners of the New York Marathon between 1970 and 1999.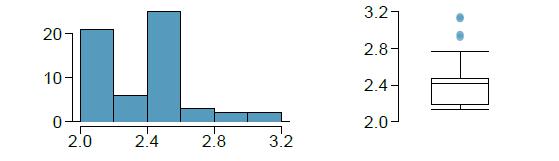
(a) What features of the distribution are apparent in the histogram and not the box plot? What features are apparent in the box plot but not in the histogram?
(b) What may be the reason for the bimodal distribution? Explain.
(c) Compare the distribution of marathon times for men and women based on the box plot shown below.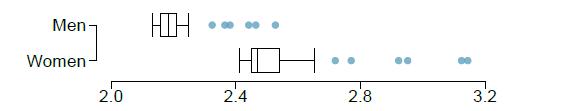
(d) The time series plot shown below is another way to look at these data. Describe what is visible in this plot but not in the others.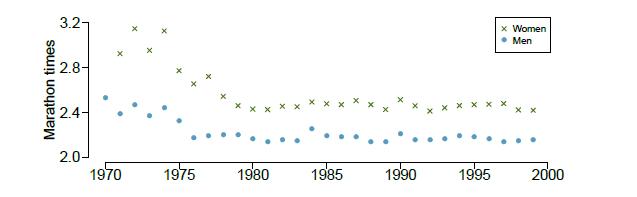
Fantastic news! We've Found the answer you've been seeking!
Step by Step Answer:
The graphs for the given problem is shown below a From the histogram we can see that the number of r...View the full answer

Answered By
Shristi Singh
A freshman year metallurgy and material science student in India.
2+ Reviews
10+ Question Solved
Related Book For 
OpenIntro Statistics
ISBN: 9781943450077
4th Edition
Authors: David Diez, Mine Çetinkaya-Rundel, Christopher Barr
Question Posted:
