

Question: The scatterplot below shows the relationship between per capita income (in thousands of dollars) and percent of population with a bachelor's degree in 3,143 counties
The scatterplot below shows the relationship between per capita income (in thousands of dollars) and percent of population with a bachelor's degree in 3,143 counties in the US in 2010.
(a) What are the explanatory and response variables?
(b) Describe the relationship between the two variables. Make sure to discuss unusual observations, if any.
(c) Can we conclude that having a bachelor's degree increases one's income?
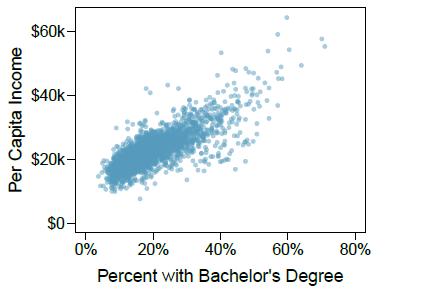
Per Capita Income $60k- $40k- $20k- $0- 0% 40% Percent with Bachelor's Degree 20% 60% 80%
Step by Step Solution
3.37 Rating (153 Votes )
There are 3 Steps involved in it
a In this scatterplot the explanatory variable also referred to as the independent variable is the P... View full answer

Get step-by-step solutions from verified subject matter experts