

Question: Problem 1.2 (Income and education in US counties). The scatterplot on the right shows the relationship between per capita income 60 (in thousands of dollars)
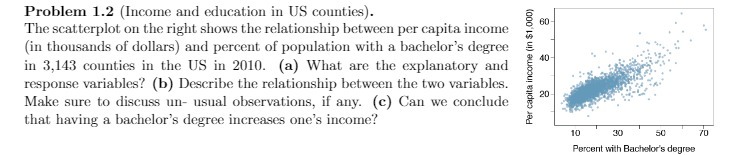
Problem 1.2 (Income and education in US counties). The scatterplot on the right shows the relationship between per capita income 60 (in thousands of dollars) and percent of population with a bachelor's degree in 3,143 counties in the US in 2010. (a) What are the explanatory and response variables? (b) Describe the relationship between the two variables. Make sure to discuss un- usual observations, if any. (c) Can we conclude 20 that having a bachelor's degree increases one's income? Per capita income (in $1,000) 40- 10 30 50 70 Percent with Bachelor's degree
Step by Step Solution
There are 3 Steps involved in it
1 Expert Approved Answer
Step: 1 Unlock

Question Has Been Solved by an Expert!
Get step-by-step solutions from verified subject matter experts
Step: 2 Unlock
Step: 3 Unlock