

Question: 12. A PERT diagram is shown below with the optimistic, most likely, and pessimistic times, in days, shown above each arrow. a. Find , for
12. A PERT diagram is shown below with the optimistic, most likely, and pessimistic times, in days, shown above each arrow.
a. Find ¢, for each activity.
b. Find the slack for each event and find the critical path.
c. What is the expected completion time?
d. What is the probability that the critical path will be completed in 45 days or less?
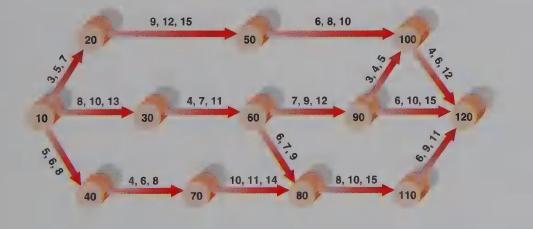
3,5,7 20 20 10 8, 10, 13 5, 6, 8 9, 12, 15 30 4,7,11 50 60 6, 8, 10 7,9,12 6,7,9 3.4.5 90 100 4,6,12 6, 10, 15 6.9.11 4,6,8 10, 11, 14 8, 10, 15 40 70 80 110 120
Step by Step Solution
There are 3 Steps involved in it
1 Expert Approved Answer
Step: 1 Unlock

Question Has Been Solved by an Expert!
Get step-by-step solutions from verified subject matter experts
Step: 2 Unlock
Step: 3 Unlock