

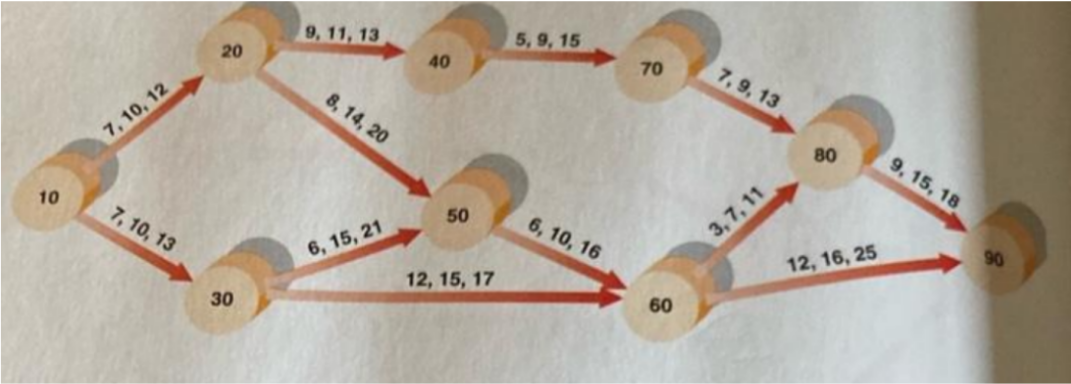
Question: A PERT diagram is shown below with the optimistic, most likely, and pessimistic times, in days, shown above each arrow. Please find the expected completion
A PERT diagram is shown below with the optimistic, most likely, and pessimistic times, in days, shown above each arrow. Please find the expected completion time and find the critical path. Then, find the standard deviation of the critical path, and figure out the probability of completing the critical path in 2 days less than the expected duration.
Step by Step Solution
There are 3 Steps involved in it
1 Expert Approved Answer
Step: 1 Unlock

Question Has Been Solved by an Expert!
Get step-by-step solutions from verified subject matter experts
Step: 2 Unlock
Step: 3 Unlock