

Question: Plot the data. Do the two variables look correlated? Chance of Rain Umbrella Sales Month (%) Forecast error (units) 22 January 1420 1337.7 82.3 February
Plot the data. Do the two variables look correlated?
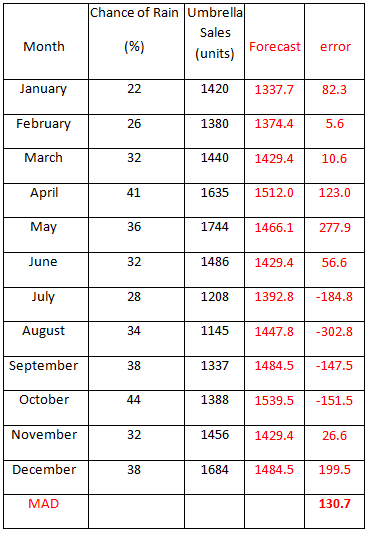
Chance of Rain Umbrella Sales Month (%) Forecast error (units) 22 January 1420 1337.7 82.3 February 1374.4 26 1380 5.6 March 32 1440 1429.4 10.6 41 April 1635 1512.0 123.0 May 36 1744 1466.1 277.9 June 32 1486 1429.4 56.6 July 28 1208 1392.8 -184.8 34 August 1145 1447.8 -302.8 September 1484.5 38 1337 -147.5 October 44 1388 1539.5 -151.5 November 32 1456 1429.4 26.6 December 38 1684 1484.5 199.5 MAD 130.7
Step by Step Solution
3.49 Rating (166 Votes )
There are 3 Steps involved in it
The plots and regression line are show... View full answer

Get step-by-step solutions from verified subject matter experts