

Question: The data presented in Table 1.6 were published in the March 1, 1984, issue of The Wall Street Journal. They relate to the advertising budget
a. Plot impressions on the vertical axis and advertising expenditure on the horizontal axis.
b. What can you say about the nature of the relationship between the two variables?
c. Looking at your graph, do you think it pays to advertise? Think about all those commercials shown on Super Bowl Sunday or during the World Series.
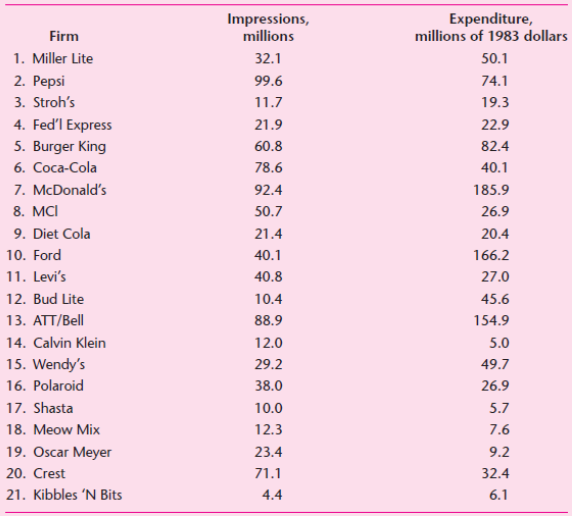
Expenditure, millions of 1983 dollars Impressions, millions Firm 1. Miller Lite 32.1 50.1 2. Pepsi 99.6 74.1 3. Stroh's 11.7 19.3 4. Fed'l Express 21.9 22.9 5. Burger King 82.4 60.8 6. Coca-Cola 78.6 40.1 7. McDonald's 92.4 185.9 8. MCI 50.7 26.9 9. Diet Cola 21.4 20.4 10. Ford 40.1 166.2 11. Levi's 40.8 27.0 12. Bud Lite 10.4 45.6 13. ATT/Bell 154.9 88.9 14. Calvin Klein 12.0 5.0 15. Wendy's 29.2 49.7 16. Polaroid 38.0 26.9 17. Shasta 10.0 5.7 18. Meow Mix 12.3 7.6 19. Oscar Meyer 20. Crest 23.4 9.2 71.1 32.4 21. Kibbles 'N Bits 4.4 6.1
Step by Step Solution
3.38 Rating (167 Votes )
There are 3 Steps involved in it
a b c As the following figure shows there seems to ... View full answer

Get step-by-step solutions from verified subject matter experts
Document Format (2 attachments)
1529_605d88e1ca594_656057.pdf
180 KBs PDF File
1529_605d88e1ca594_656057.docx
120 KBs Word File