

Question: Refer to the data in Solved Problem F.1 which deals with Higgins Plumbing and Heating. Higgins has now collected 100 weeks of data and finds
Refer to the data in Solved Problem F.1 which deals with Higgins Plumbing and Heating. Higgins has now collected 100 weeks of data and finds the following distribution for sales:
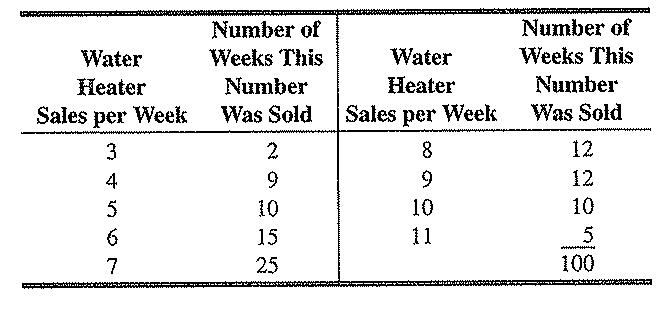
a) Assuming that Higgins maintains a constant supply of 8 heaters simulate the number of stockouts incurred over a 20-week period (using the seventh column of Table F.4).
b) Conduct this 20-week simulation two more times and compare your answers with those in part (a). Did they change significantly? Why or why not?
c) What is the new expected number of sales per week?
Step by Step Solution
3.34 Rating (157 Votes )
There are 3 Steps involved in it
a Using the seventh column of Table F4 we can simulate the number of stockouts over a 20week period as follows Week 1 3 stockouts 1073 Week 2 2 stocko... View full answer

Get step-by-step solutions from verified subject matter experts