

Question: -13-17 Refer to the data in Solved Problem 13.1, which deals with Higgins Plumbing and Heating. Higgi has now collected 100 weeks of data
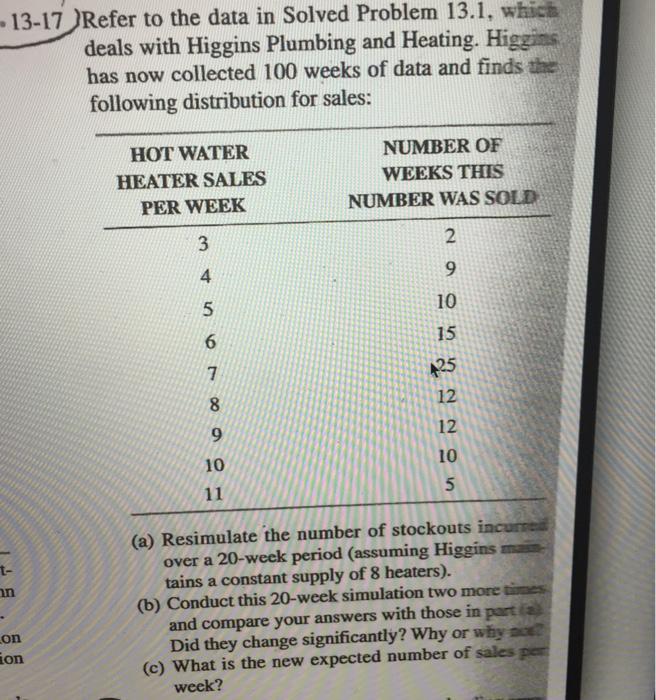
-13-17 Refer to the data in Solved Problem 13.1, which deals with Higgins Plumbing and Heating. Higgi has now collected 100 weeks of data and finds the following distribution for sales: HOT WATER HEATER SALES PER WEEK 3 4 565 7 NUMBER OF WEEKS THIS NUMBER WAS SOLD 2 9 10 15 8 9 25 2205 t- n Lon ion 10 11 (a) Resimulate the number of stockouts incurred over a 20-week period (assuming Higgins main tains a constant supply of 8 heaters). (b) Conduct this 20-week simulation two more times and compare your answers with those in part (a) Did they change significantly? Why or why not? (c) What is the new expected number of sales per week?
Step by Step Solution
There are 3 Steps involved in it

Get step-by-step solutions from verified subject matter experts