

Question: The table below provides information about the demand forecast and the number of working days for a tools manufacturing factory in Egypt. Construct a graph
The table below provides information about the demand forecast and the number of working days for a tools manufacturing factory in Egypt.
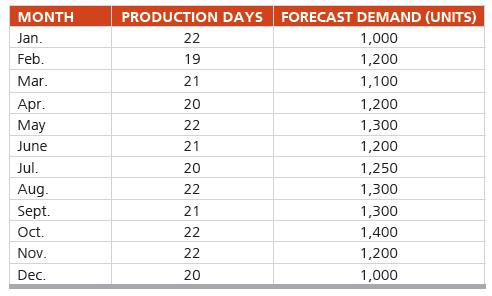
Construct a graph for the daily demand and the average daily demand forecast.
MONTH Jan. Feb. Mar. Apr. May June Jul. Aug. Sept. Oct. Nov. Dec. PRODUCTION DAYS FORECAST DEMAND (UNITS) 1,000 1,200 1,100 22 19 21 20 22 21 20 22 21 22 22 20 1,200 1,300 1,200 1,250 1,300 1,300 1,400 1,200 1,000
Step by Step Solution
3.46 Rating (169 Votes )
There are 3 Steps involved in it
Month Production Days Jan Feb Mar Apr May Jun July A... View full answer

Get step-by-step solutions from verified subject matter experts