

Question: Figure P.11.30 shows two functions. Convolve them graphically and draw a plot of the result. Figure P.11.30 f(x) h(x) 3 1 1 2 3 4
Figure P.11.30 shows two functions. Convolve them graphically and draw a plot of the result.
Figure P.11.30
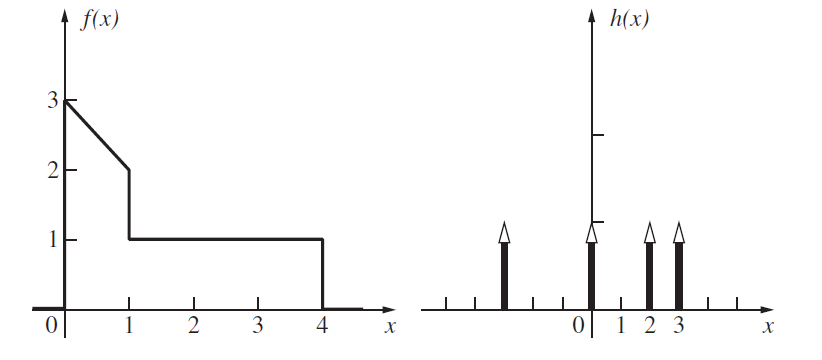
f(x) h(x) 3 1 1 2 3 4 1 2 3
Step by Step Solution
★★★★★
3.37 Rating (163 Votes )
There are 3 Steps involved in it
1 Expert Approved Answer
Step: 1 Unlock

To graphically convolve two functions fx and hx we need to follow several steps flipping one function shifting it multiplying with the other function ... View full answer
Question Has Been Solved by an Expert!
Get step-by-step solutions from verified subject matter experts
Step: 2 Unlock
Step: 3 Unlock