

Question: (a) From Figure 2.6, how many seconds did it take me to go from (x=+1.0 mathrm{~m}) to (x=+4.0 mathrm{~m}) ? (b) From (x=+2.0 mathrm{~m}) to
(a) From Figure 2.6, how many seconds did it take me to go from \(x=+1.0 \mathrm{~m}\) to \(x=+4.0 \mathrm{~m}\) ?
(b) From \(x=+2.0 \mathrm{~m}\) to \(x=+3.0 \mathrm{~m}\) ?
(c) At what instant did I reach \(x=+2.5 \mathrm{~m}\) ?
(d) For how long was I at \(x=+2.5 \mathrm{~m}\) ?
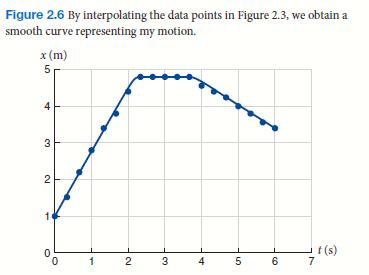
Figure 2.6 By interpolating the data points in Figure 2.3, we obtain a smooth curve representing my motion. x (m) 5p 4 3 2 1 0 0 2 3 4 t(s) 5 6 7
Step by Step Solution
3.43 Rating (156 Votes )
There are 3 Steps involved in it
a A vertical line drawn from the first x40 mathrmm point down to the horizontal axis tells you that ... View full answer

Get step-by-step solutions from verified subject matter experts