

The curve in Figure 2.8 can be mathematically represented by the function (x(t)=a+b t+c t^{2}), where (a=0.50
Question:
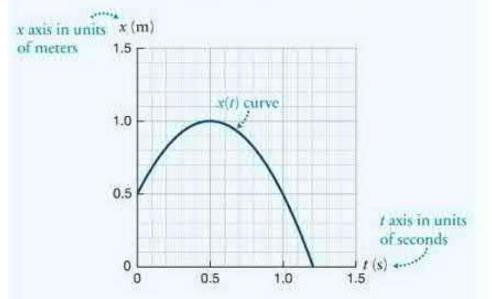
The curve in Figure 2.8 can be mathematically represented by the function \(x(t)=a+b t+c t^{2}\), where \(a=0.50 \mathrm{~m}\), \(b=+2.0 \mathrm{~m} / \mathrm{s}\), and \(c=-2.0 \mathrm{~m} / \mathrm{s}^{2}\). Use this function to answer the four questions in Example 2.1.
Data from Figure 2.8
Data from Example 2.1
The curve in Figure 2.8 is a graphical representation of the motion of a certain object.
(a) What was the \(x\) coordinate of the object at \(t=0.50 \mathrm{~s}\) ?
(b) At what instant(s) did the object reach \(x=+0.80 \mathrm{~m}\) ?
(c) What distance did the object travel between \(t=0.80 \mathrm{~s}\) and \(t=1.2 \mathrm{~s}\) ?
(d) How long did it take for the object to move from \(x=+1.0 \mathrm{~m}\) to \(x=0\) ?
Fantastic news! We've Found the answer you've been seeking!
Step by Step Answer:

Answered By
Allan Olal
I have vast tutoring experience of more than 8 years and my primary objective as a tutor is to ensure that a student achieves their academic goals.
78+ Reviews
410+ Question Solved
Related Book For 
Question Posted:
