

Question: Consider the equilibrium states represented by points 1 and 2 in Figure 20.20a. Compare these quantities for an ideal gas in these two states: pressure
Consider the equilibrium states represented by points 1 and 2 in Figure 20.20a. Compare these quantities for an ideal gas in these two states: pressure \(P\), volume \(V\), temperature \(T\), entropy \(S\), and thermal energy \(E_{\text {th }}\).
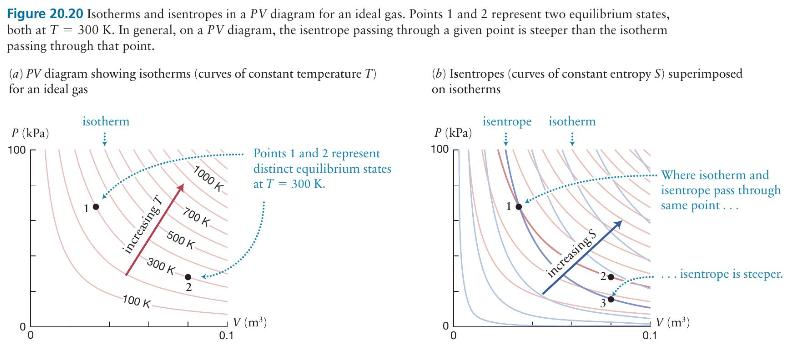
Figure 20.20 Isotherms and isentropes in a PV diagram for an ideal gas. Points 1 and 2 represent two equilibrium states, both at T = 300 K. In general, on a PV diagram, the isentrope passing through a given point is steeper than the isotherm passing through that point. (a) PV diagram showing isotherms (curves of constant temperature T') for an ideal gas P (kPa) 100 isotherm (b) Isentropes (curves of constant entropy S) superimposed on isotherms isentrope isotherm P (kPa) 100 1 0 increasing T 1000 K- 700 K 500 K 300 K- 100 K 2 Points 1 and 2 represent distinct equilibrium states at T = 300 K. V (m') 0.1 0 0 increasing S Where isotherm and isentrope pass through same point.... 3 .. isentrope is steeper. 0.1 V (m)
Step by Step Solution
3.31 Rating (157 Votes )
There are 3 Steps involved in it

Get step-by-step solutions from verified subject matter experts