

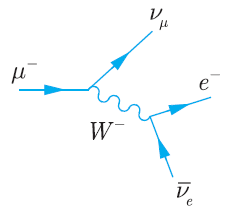
Figure 2.5 shows one of the time-ordered diagrams for muon decay μ e Î½Ì e ν μ
Question:
Figure 2.5
Fantastic news! We've Found the answer you've been seeking!
Step by Step Answer:
The basic processes are W and W ...View the full answer

Answered By
MICHAEL KICHE
I was employed studypool for the first time in tutoring. I did well since most of my students and clients got the necessary information and knowledge requested for. I always submitted the answers in time and followed the correct formatting in answering eg MLA or APA format,
Again I worked with the writers bay where I did writing and got many clients whom we worked with so closely. They enjoyed every single service I delivered to them. My answers are always correct.
13+ Reviews
53+ Question Solved
Related Book For 

Question Posted:
