

Figure (P 20. 28) is the (P V) diagram for a process carried out on (10 mathrm{~mol})
Question:
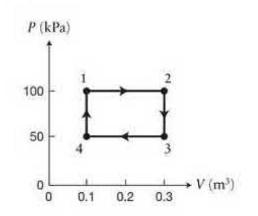
Figure \(P 20. 28\) is the \(P V\) diagram for a process carried out on \(10 \mathrm{~mol}\) of an ideal gas in thermal equilibrium that begins and ends on the same state (the initial state \(i\) and the final state \(\mathrm{f}\) for the gas are at 1).
(a) Characterize each leg of the process \(-1 \rightarrow 2,2 \rightarrow 3,3 \rightarrow 4,4 \rightarrow 1-\) as being isothermal, isobaric, isochoric, or isentropic.
(b) Determine the temperature at state 1 and at state 3.
Data from Figure P20.28
Fantastic news! We've Found the answer you've been seeking!
Step by Step Answer:

Answered By
Mugdha Sisodiya
My self Mugdha Sisodiya from Chhattisgarh India. I have completed my Bachelors degree in 2015 and My Master in Commerce degree in 2016. I am having expertise in Management, Cost and Finance Accounts. Further I have completed my Chartered Accountant and working as a Professional.
Since 2012 I am providing home tutions.
2+ Reviews
10+ Question Solved
Related Book For 
Question Posted:
