

Question: Figure P20.27 shows two processes, A and B, carried out on an ideal gas. In which process was the amount of work done by the
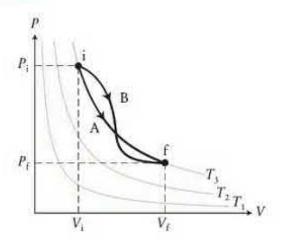
Figure P20.27 shows two processes, A and B, carried out on an ideal gas. In which process was the amount of work done by the gas greater?
Data from Figure P20.27
P B T, TTV
Step by Step Solution
★★★★★
3.42 Rating (158 Votes )
There are 3 Steps involved in it
1 Expert Approved Answer
Step: 1 Unlock

Question Has Been Solved by an Expert!
Get step-by-step solutions from verified subject matter experts
Step: 2 Unlock
Step: 3 Unlock