

Figure P3.32 shows a graph of velocity as a function of time for a cart moving along
Question:
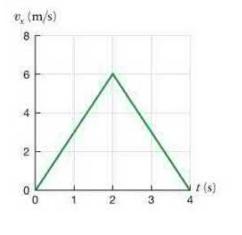
Figure P3.32 shows a graph of velocity as a function of time for a cart moving along a horizontal surface. When asked to describe the motion that resulted in this graph, a student states, "The cart first moved forward with a constant speed, reached a maximum distance at time 2 seconds, then turned around and came back to its initial position at time 4 seconds." What is your assessment of this comment?
Data form Figure P3.32
Step by Step Answer:

This question has not been answered yet.
You can Ask your question!
Related Book For 
Question Posted:
