

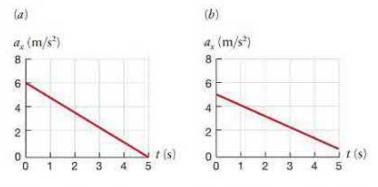
Figure P3.76 shows graphs of the (x) component of acceleration as a function of time for two
Question:
Figure P3.76 shows graphs of the \(x\) component of acceleration as a function of time for two different carts rolling along a flat horizontal table. In which case is the change in the \(x\) component of velocity greater over the time interval shown?
Data from Figure P3.76
Fantastic news! We've Found the answer you've been seeking!
Step by Step Answer:

Answered By
OTIENO OBADO
I have a vast experience in teaching, mentoring and tutoring. I handle student concerns diligently and my academic background is undeniably aesthetic
3+ Reviews
10+ Question Solved
Related Book For 

Question Posted:
