

Question: Norvell Napier Annual Date Close Price Dividend Return (%) Close Price Dividend Annual Return (%) 12/31/2018 32.00 30.00 12/31/2019 37.45 1.02 20.22 33.45 0.98
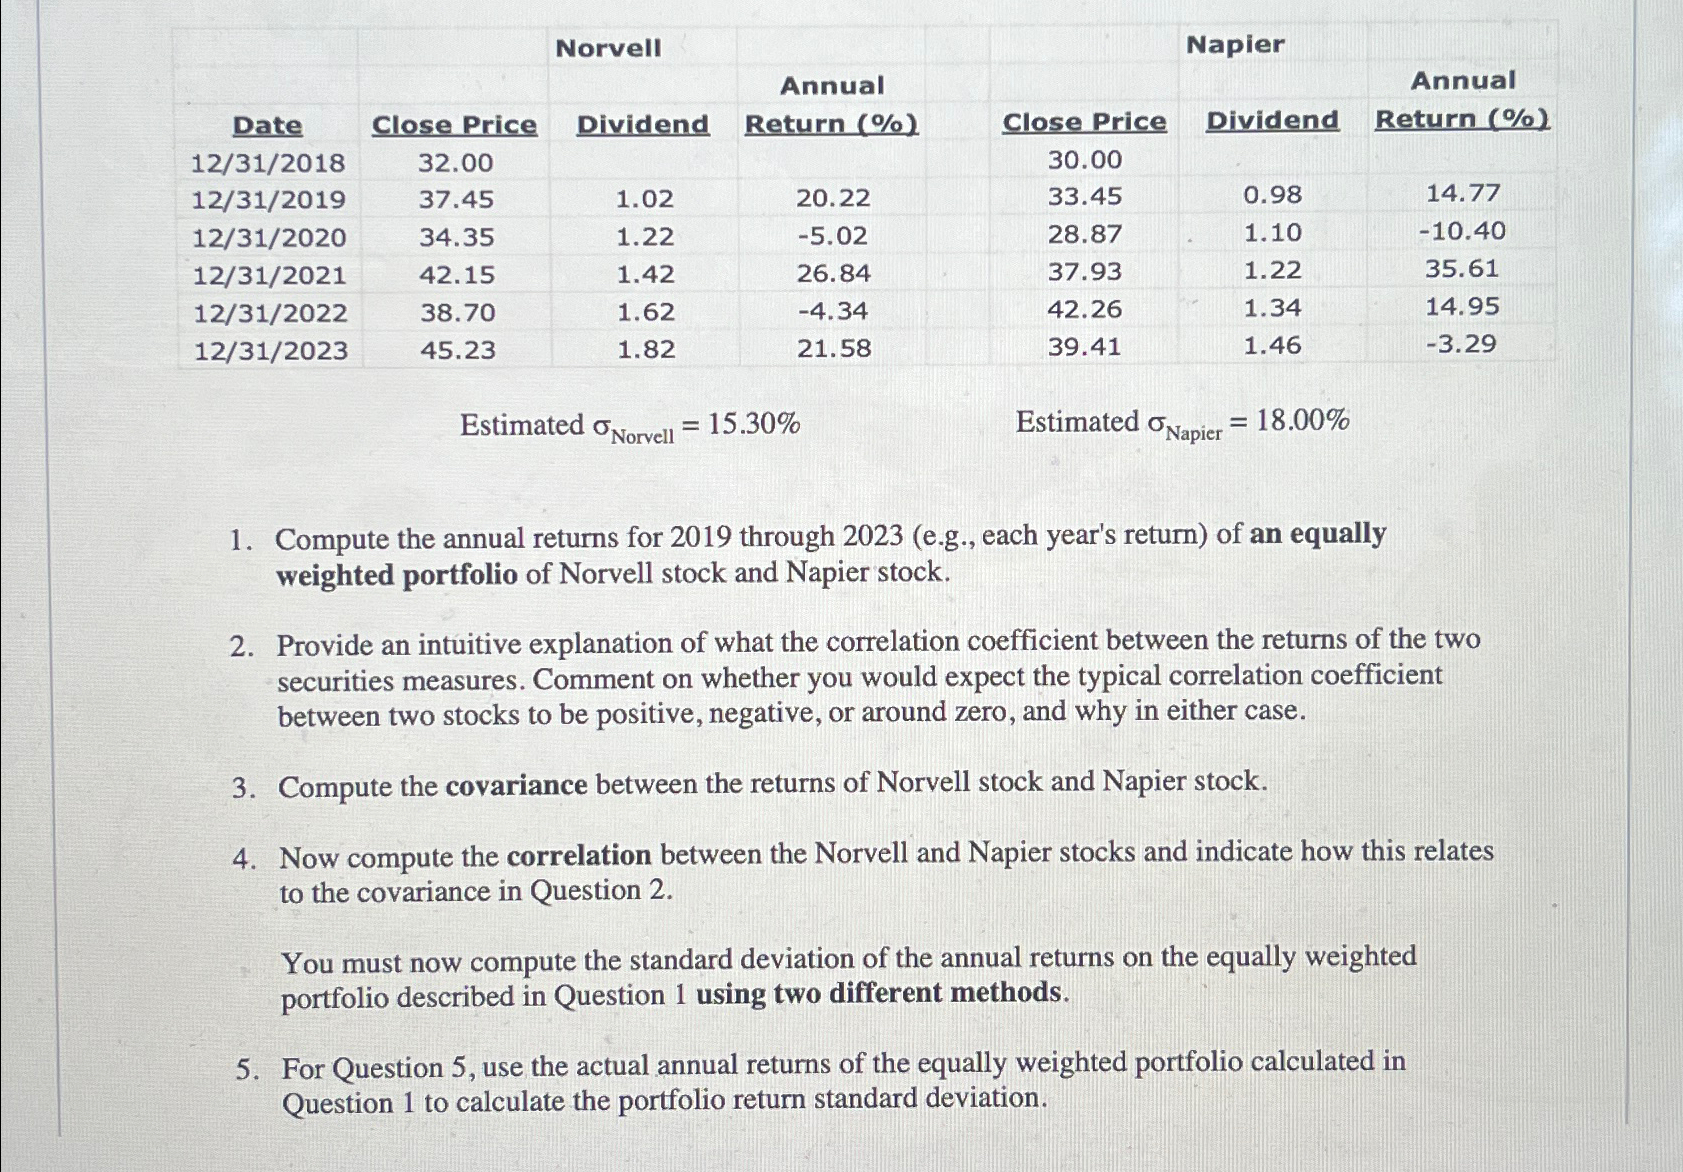
Norvell Napier Annual Date Close Price Dividend Return (%) Close Price Dividend Annual Return (%) 12/31/2018 32.00 30.00 12/31/2019 37.45 1.02 20.22 33.45 0.98 14.77 12/31/2020 34.35 1.22 -5.02 28.87 1.10 -10.40 12/31/2021 42.15 1.42 26.84 37.93 1.22 35.61 12/31/2022 38.70 1.62 -4.34 42.26 1.34 14.95 12/31/2023 45.23 1.82 21.58 39.41 1.46 -3.29 Estimated Norvell = 15.30% Estimated Napier 18.00% 1. Compute the annual returns for 2019 through 2023 (e.g., each year's return) of an equally weighted portfolio of Norvell stock and Napier stock. 2. Provide an intuitive explanation of what the correlation coefficient between the returns of the two securities measures. Comment on whether you would expect the typical correlation coefficient between two stocks to be positive, negative, or around zero, and why in either case. 3. Compute the covariance between the returns of Norvell stock and Napier stock. 4. Now compute the correlation between the Norvell and Napier stocks and indicate how this relates to the covariance in Question 2. You must now compute the standard deviation of the annual returns on the equally weighted portfolio described in Question 1 using two different methods. 5. For Question 5, use the actual annual returns of the equally weighted portfolio calculated in Question 1 to calculate the portfolio return standard deviation.
Step by Step Solution
There are 3 Steps involved in it

Get step-by-step solutions from verified subject matter experts