

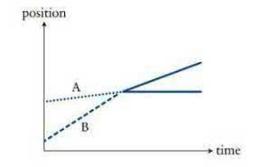
Question: Figure P4.9 is the position-versus-time graph for a collision, along a straight line, between two identical amusement-park bumper cars A and B. The inertias of
Figure P4.9 is the position-versus-time graph for a collision, along a straight line, between two identical amusement-park bumper cars A and B. The inertias of the passengers are different.
(a) Which post-collision solid line is a continuation of the dotted line for car A? Which is a continuation of the dashed line for car B?
(b) Which car contains the passenger having the greater inertia?
Data from Figure P4.9
position time
Step by Step Solution
★★★★★
3.42 Rating (158 Votes )
There are 3 Steps involved in it
1 Expert Approved Answer
Step: 1 Unlock

Question Has Been Solved by an Expert!
Get step-by-step solutions from verified subject matter experts
Step: 2 Unlock
Step: 3 Unlock