

Question: How would graphs (c) and (d) in Figure 3. 8 be different if the same experiment was conducted on the surface of the Moon, where
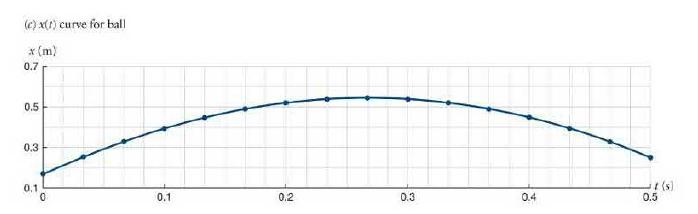
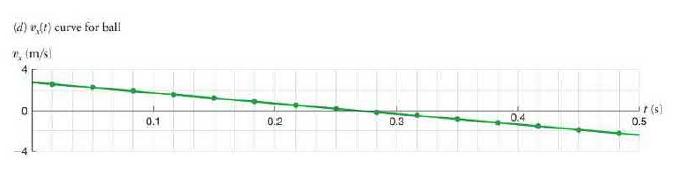
How would graphs \(c\) and \(d\) in Figure 3. 8 be different if the same experiment was conducted on the surface of the Moon, where the acceleration due to gravity is six times less than it is on Earth?
Data from Figure 3. 8
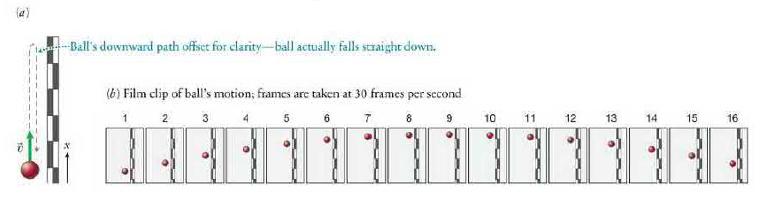
Ball's downward path offset for clarity-ball actually falls straight down. (6) Film clip of ball's motion; frames are taken at 30 frames per second 1 2 3 4 5 6 7 8 9 10 11 12 13 14 15 16 169
Step by Step Solution
★★★★★
3.39 Rating (155 Votes )
There are 3 Steps involved in it
1 Expert Approved Answer
Step: 1 Unlock

Question Has Been Solved by an Expert!
Get step-by-step solutions from verified subject matter experts
Step: 2 Unlock
Step: 3 Unlock