

Question: HOMEWORK - GUIDED PHET INQUIRY FOR SIMPLE PENDULUM PHET LINK: HTTPS://PHET.COLORADO.EDU/SIMS/HTML/PENDULUM-LAB/LATEST/PENDULUM-LAB_EN.HTML Part 1 - Energy in a Pendulum (13 points) Pendulum Lab Directions 1. Go
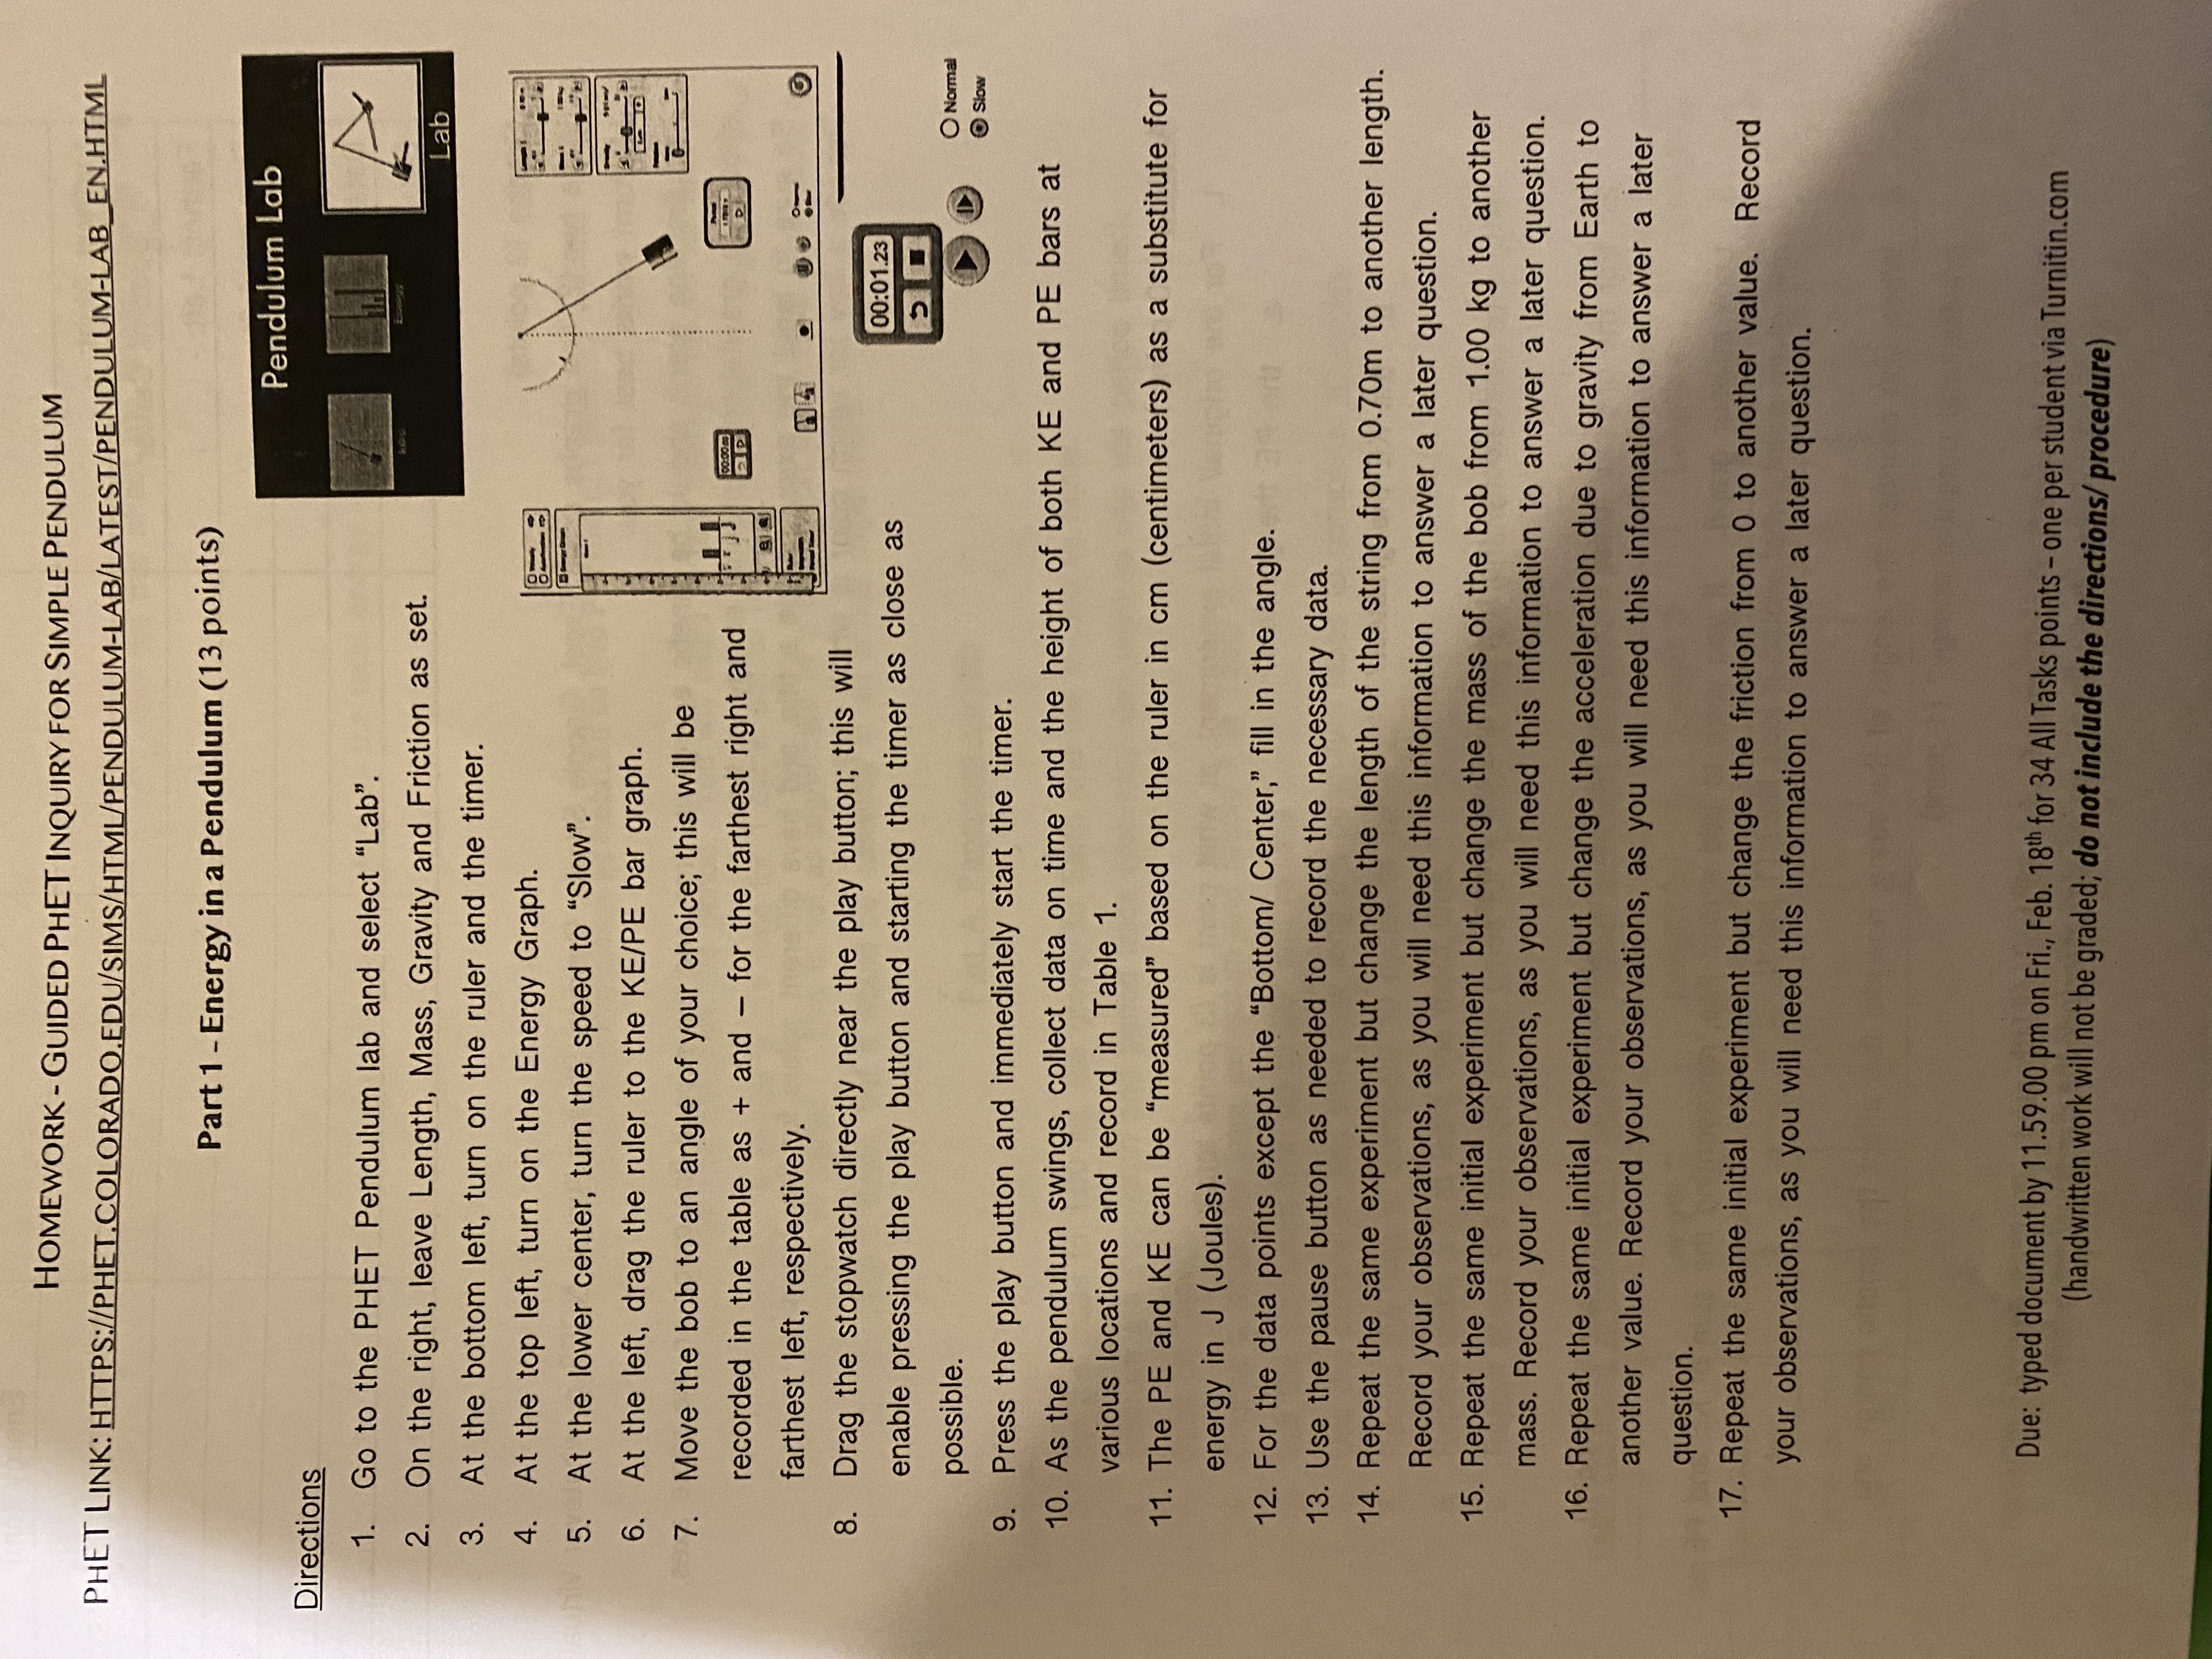
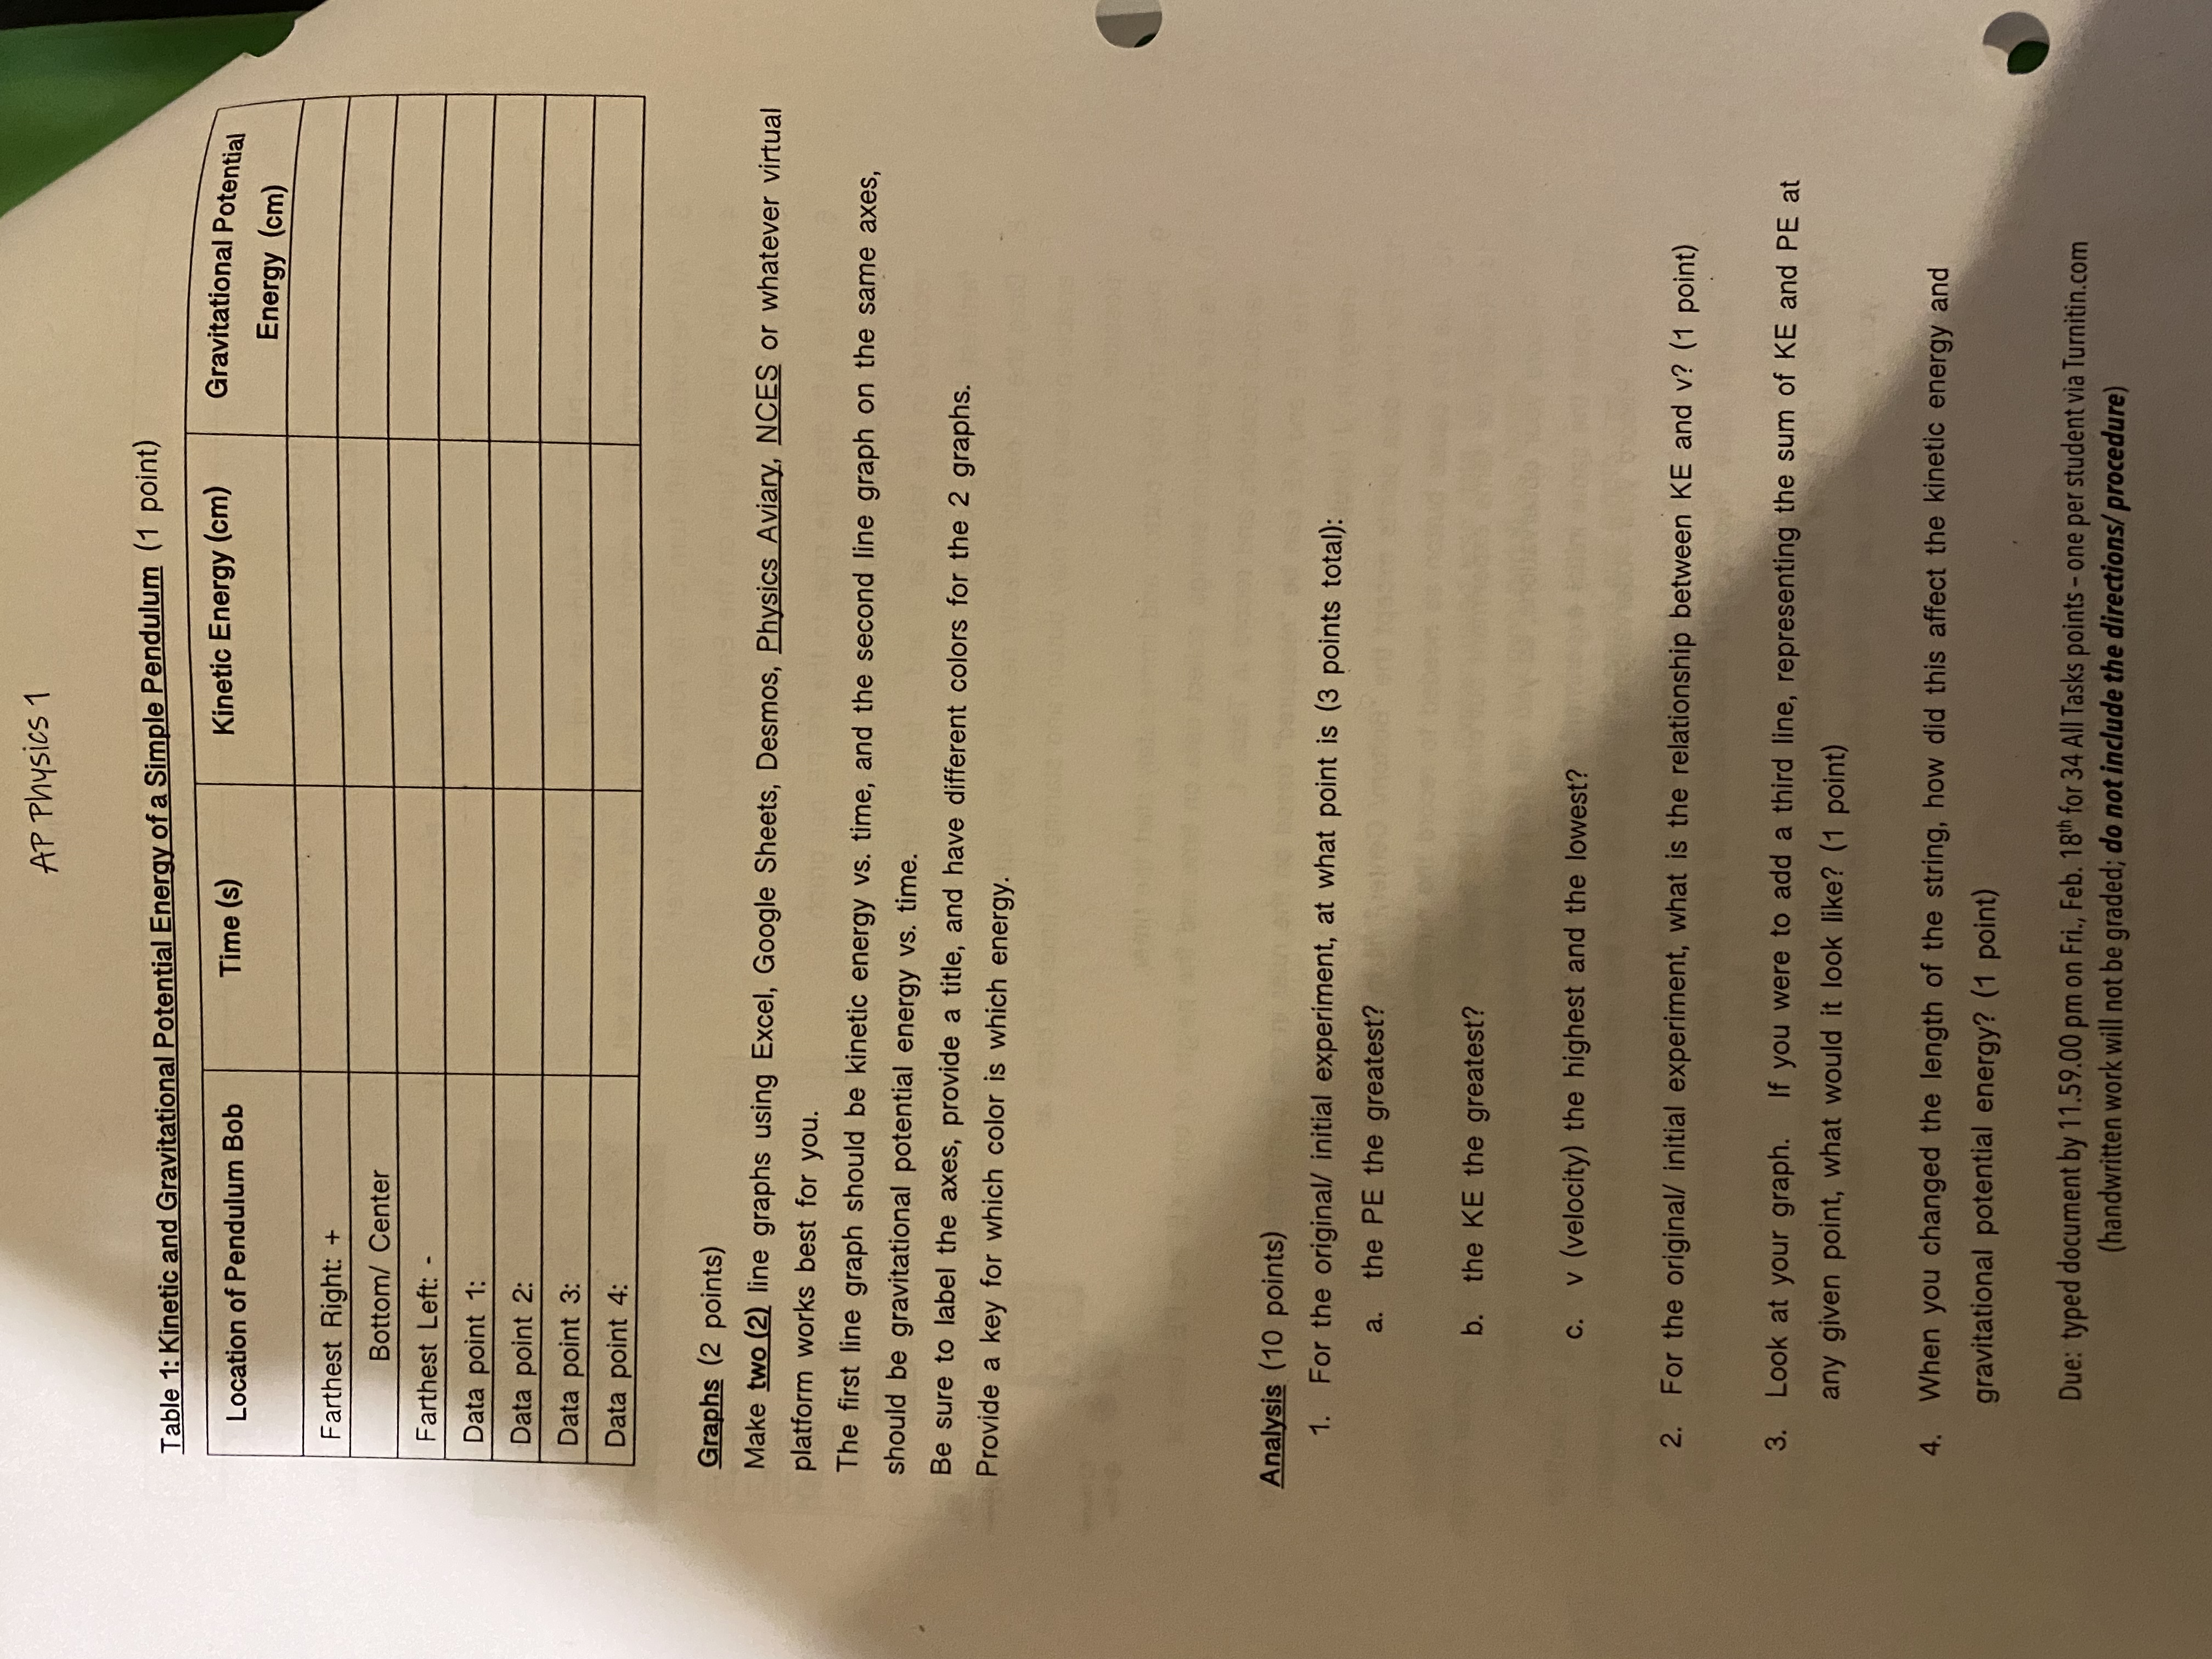
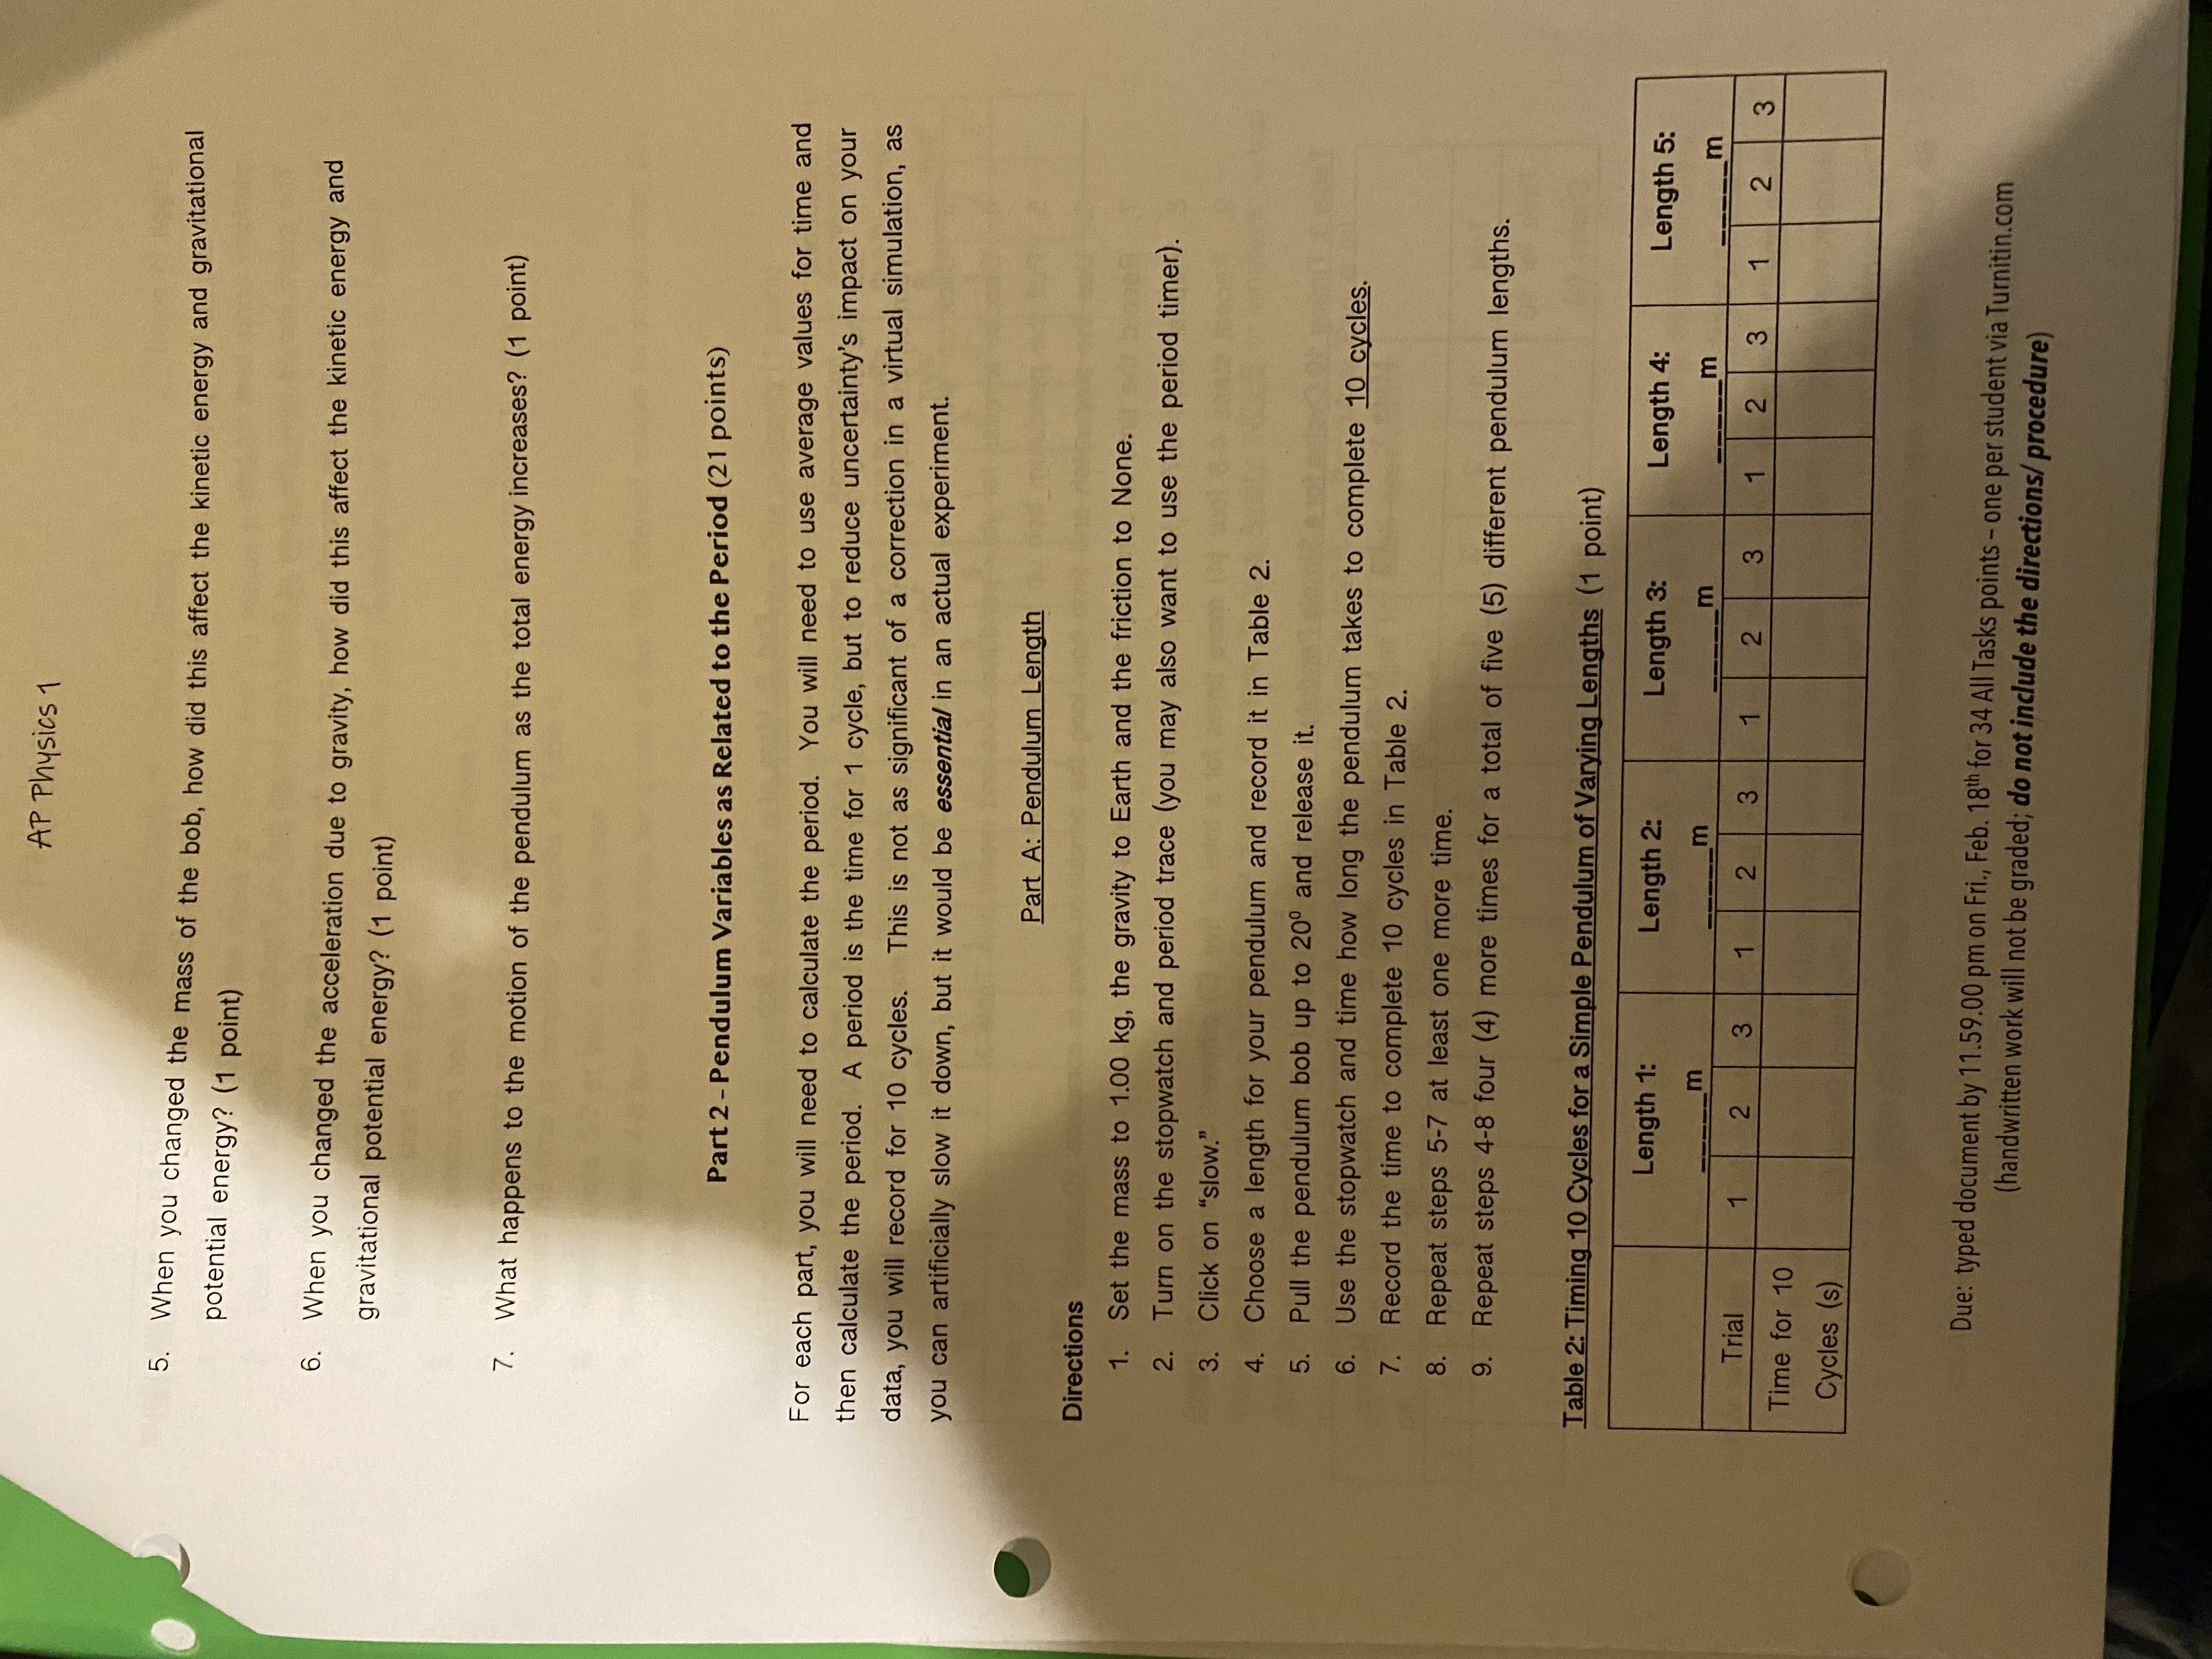
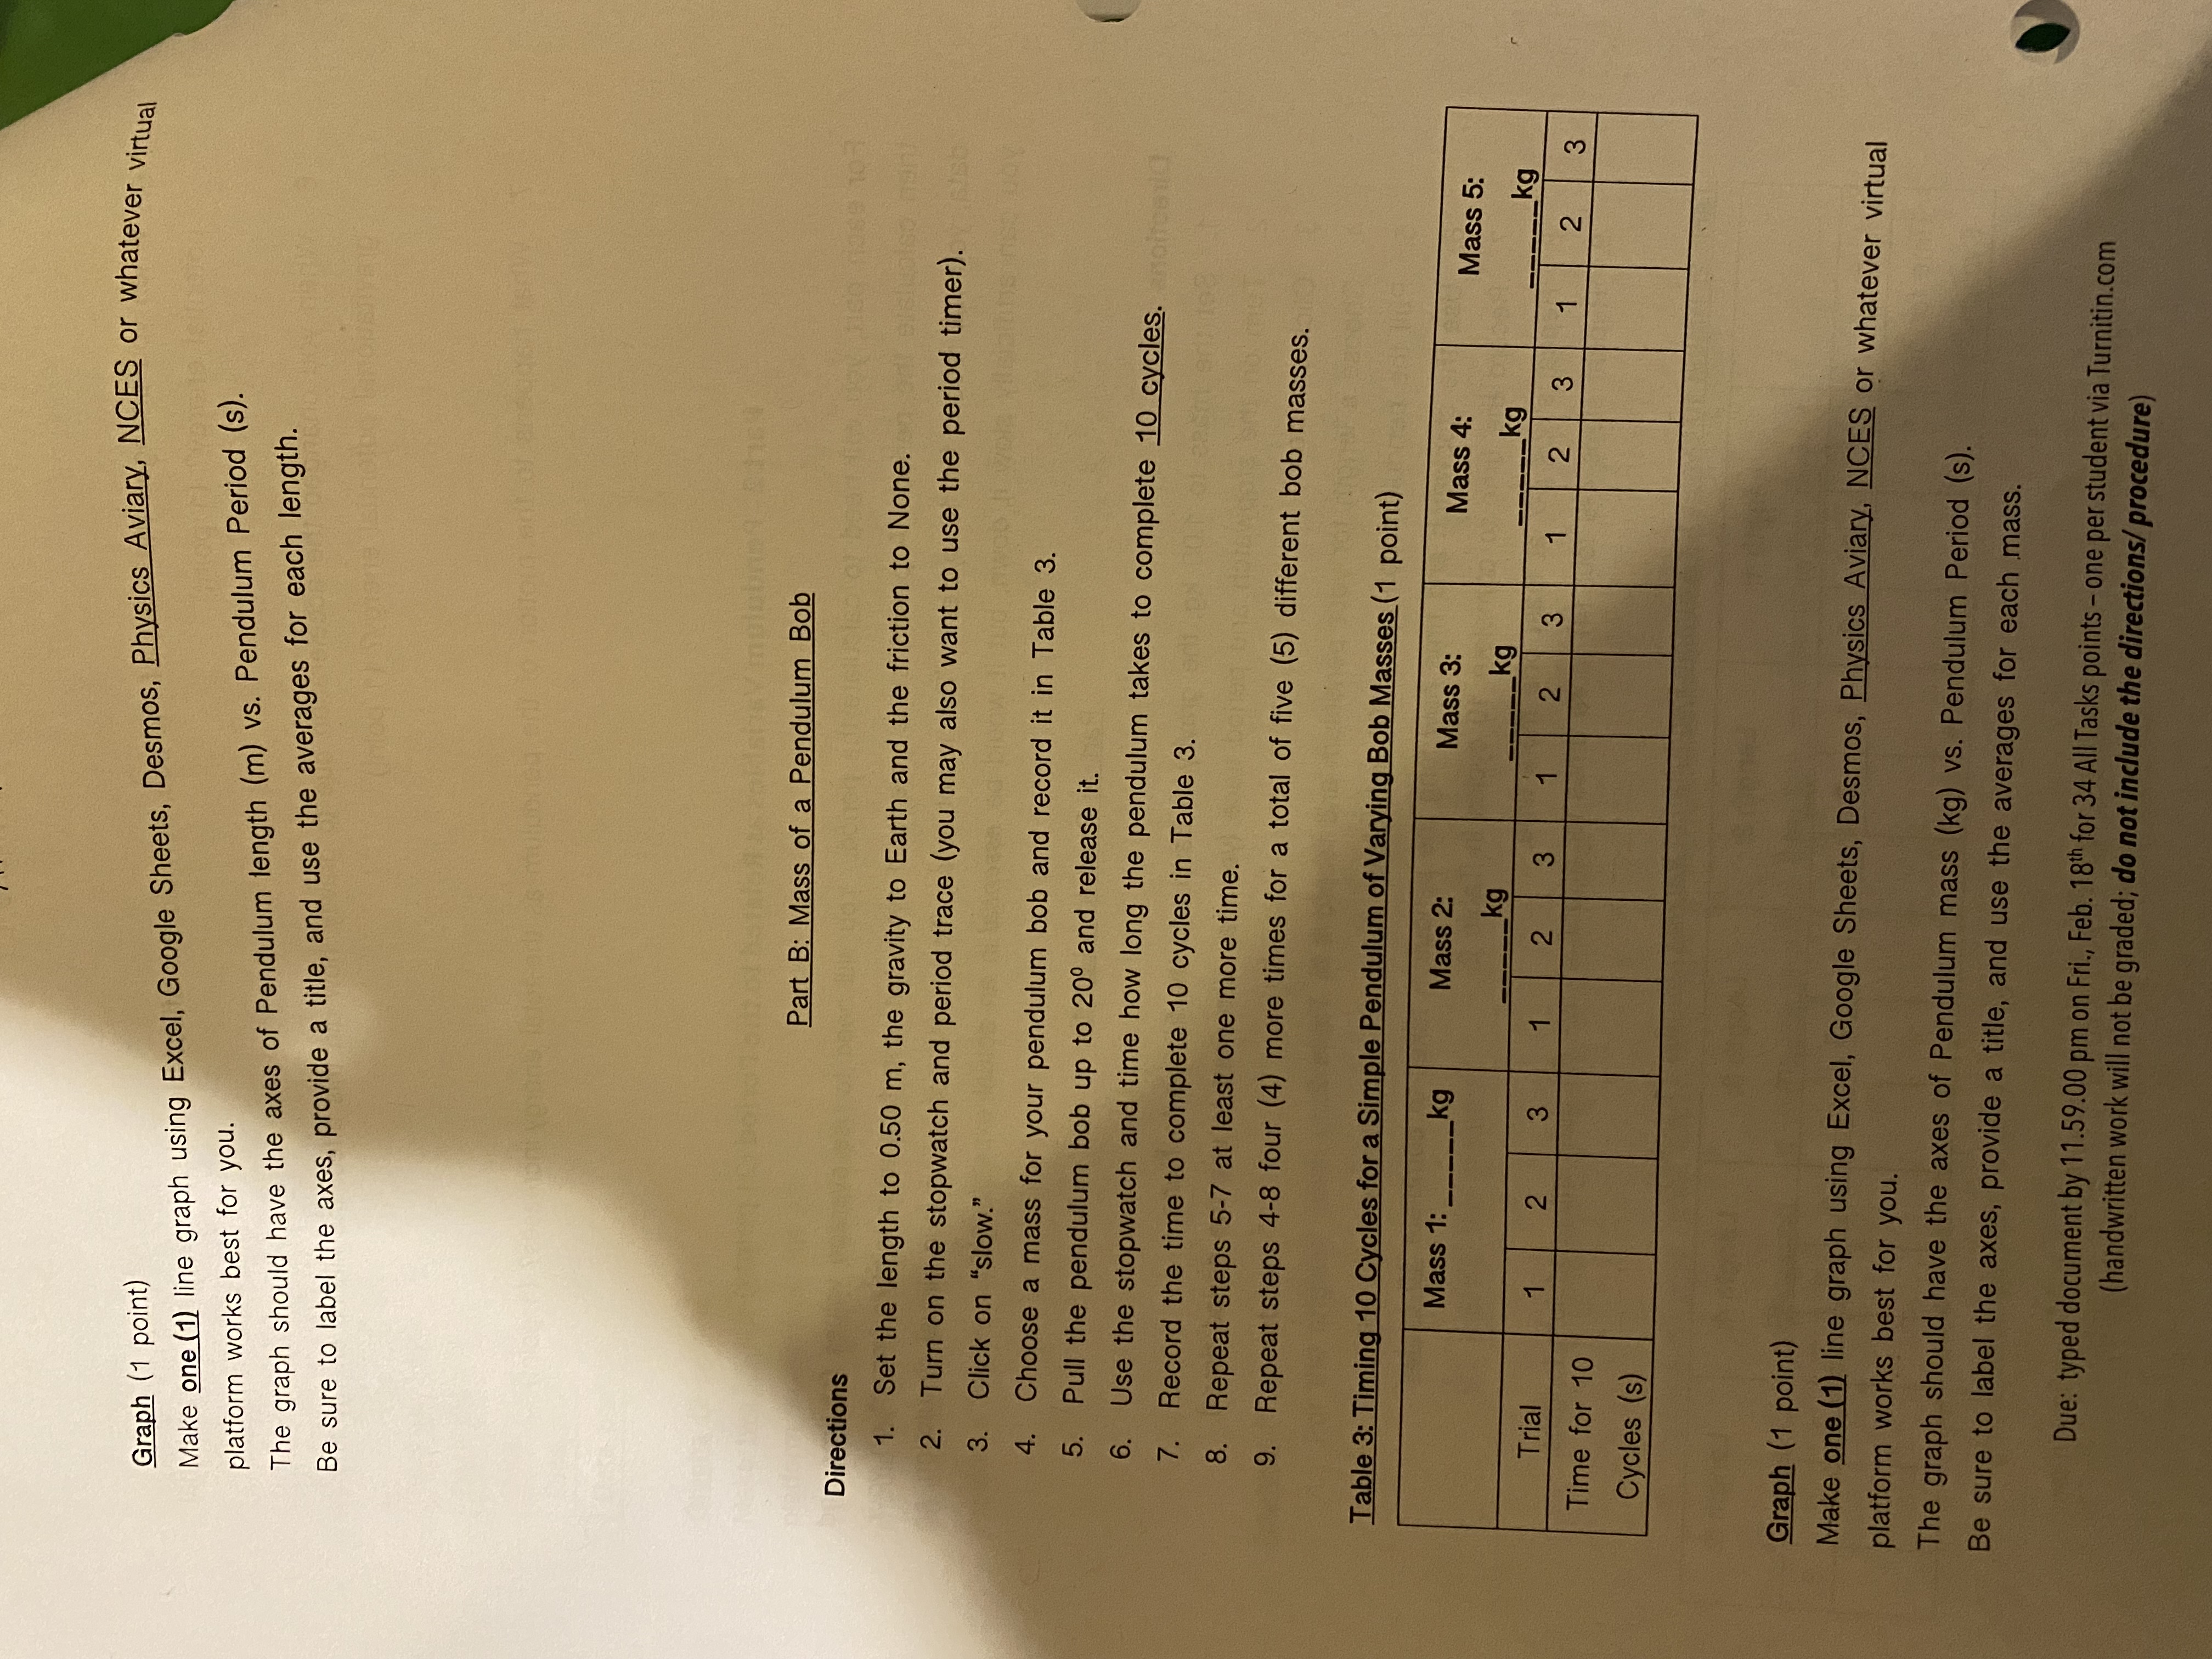
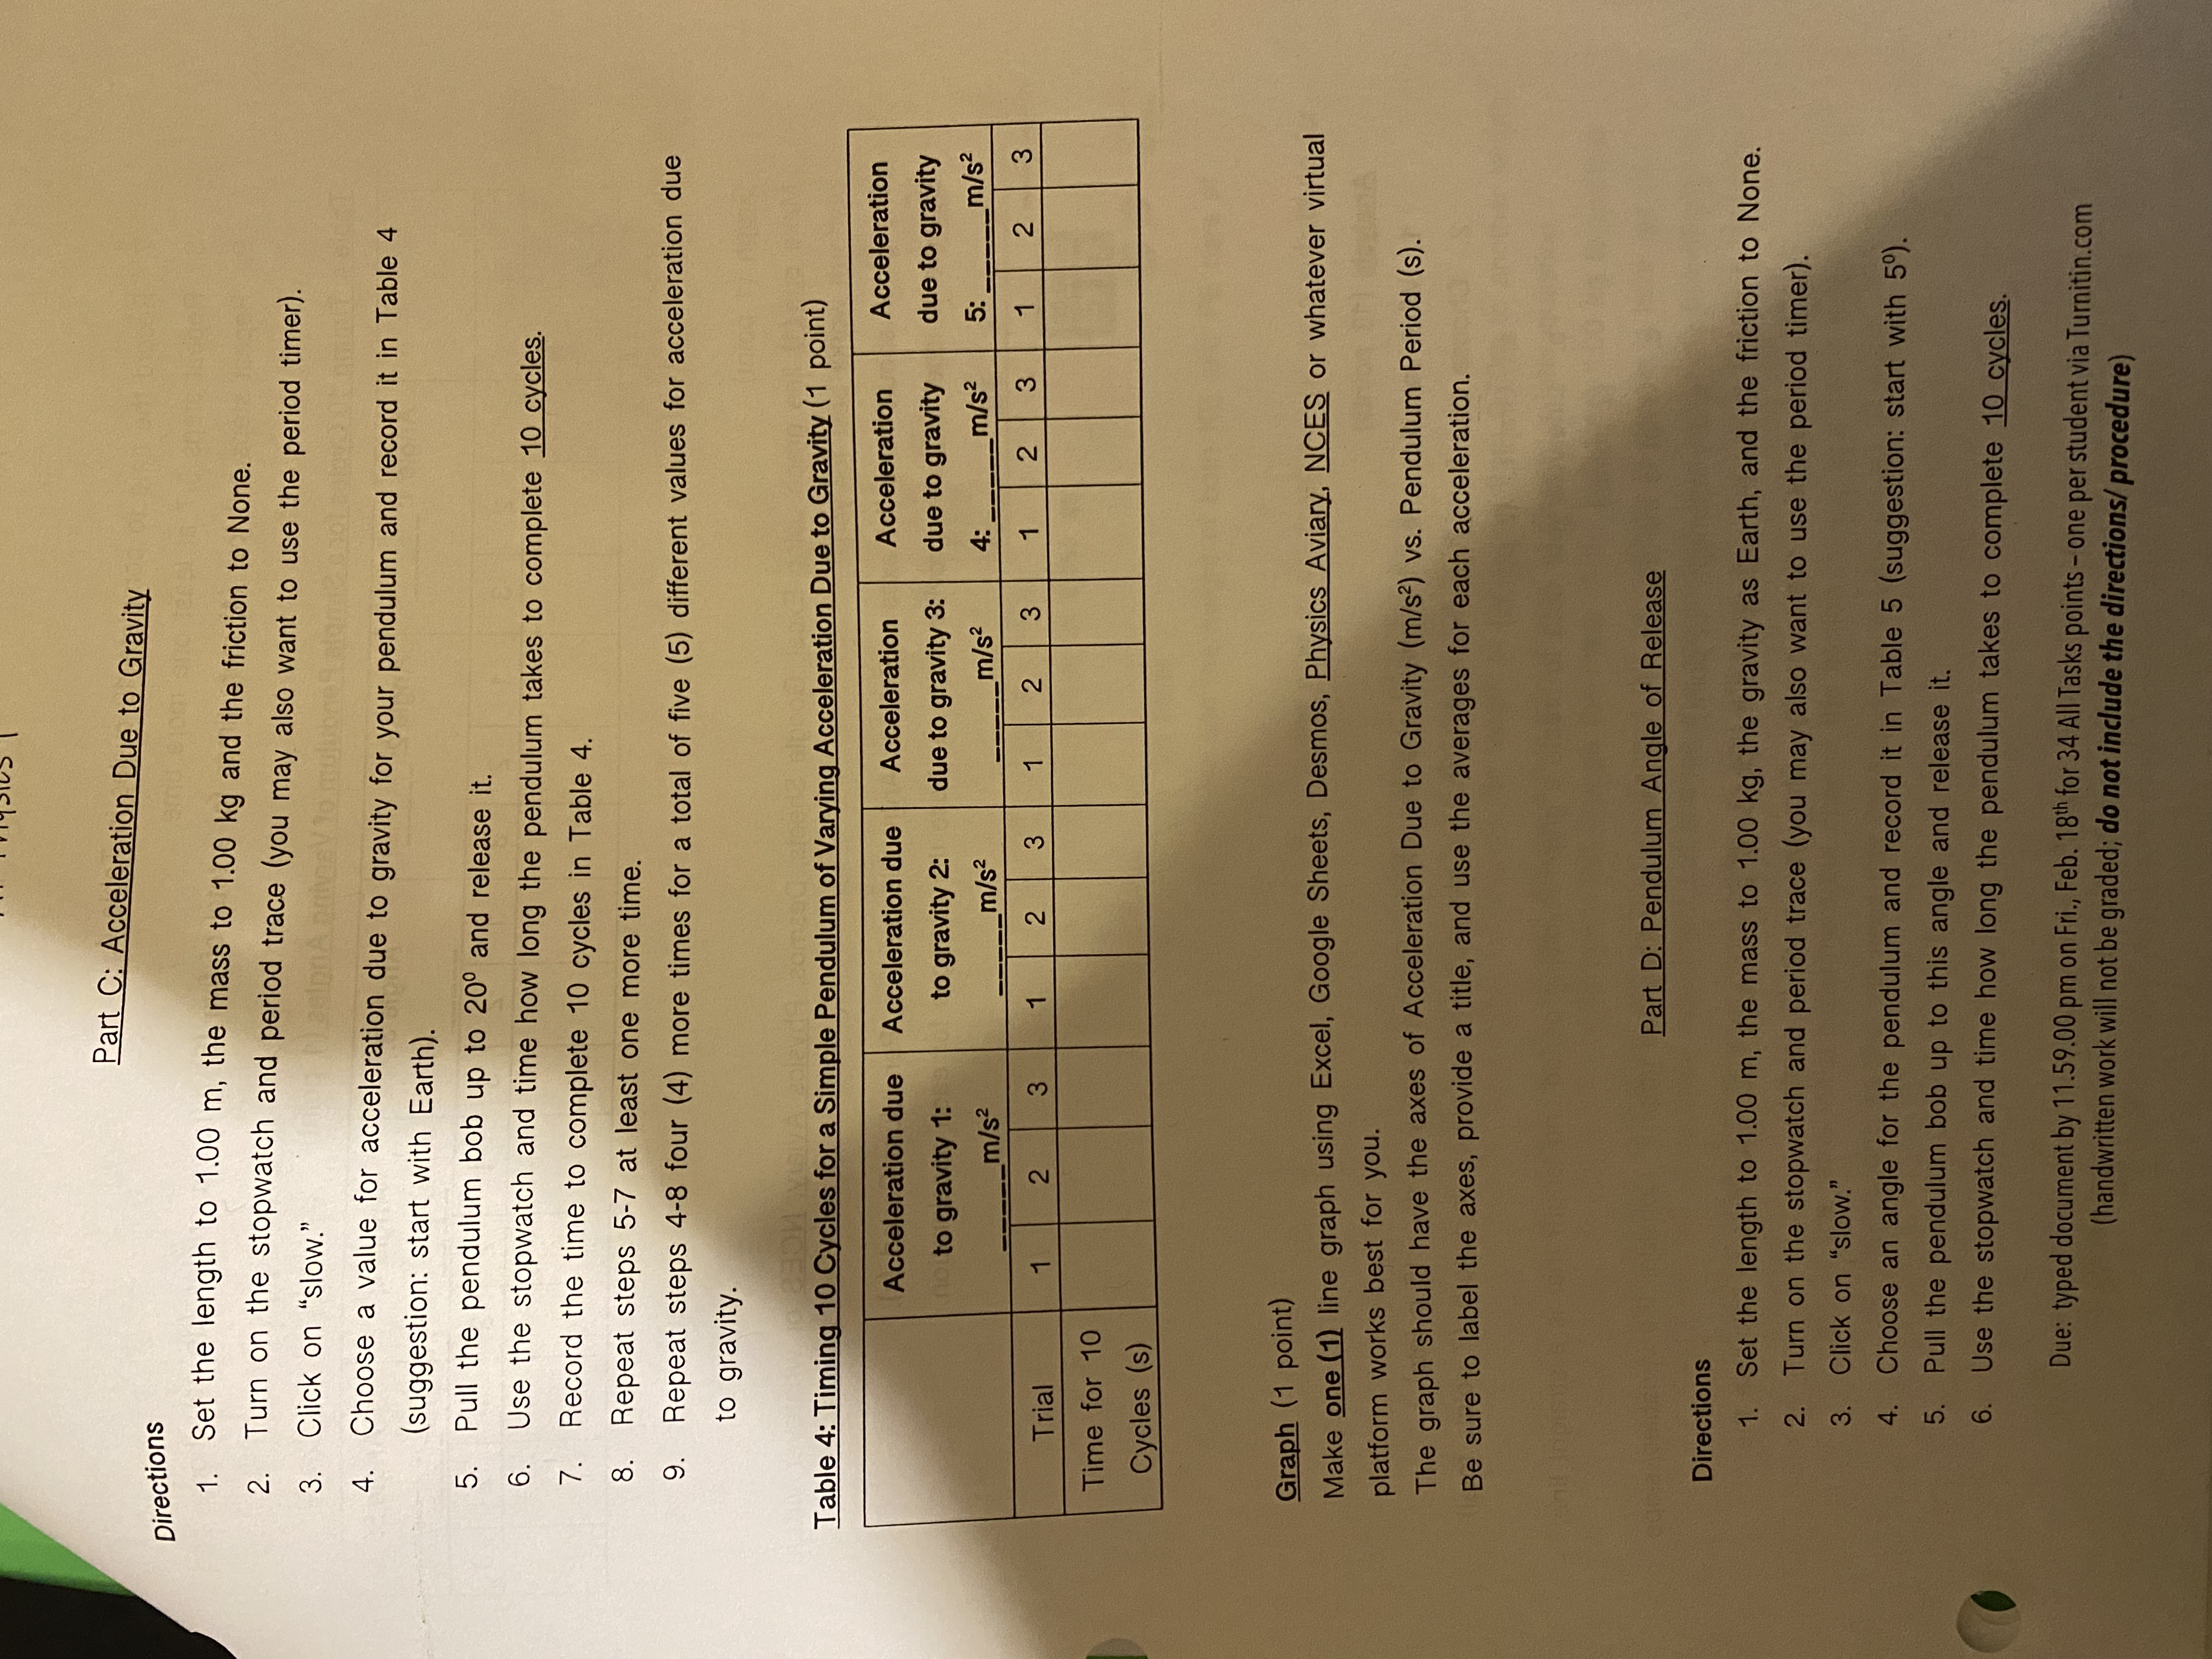
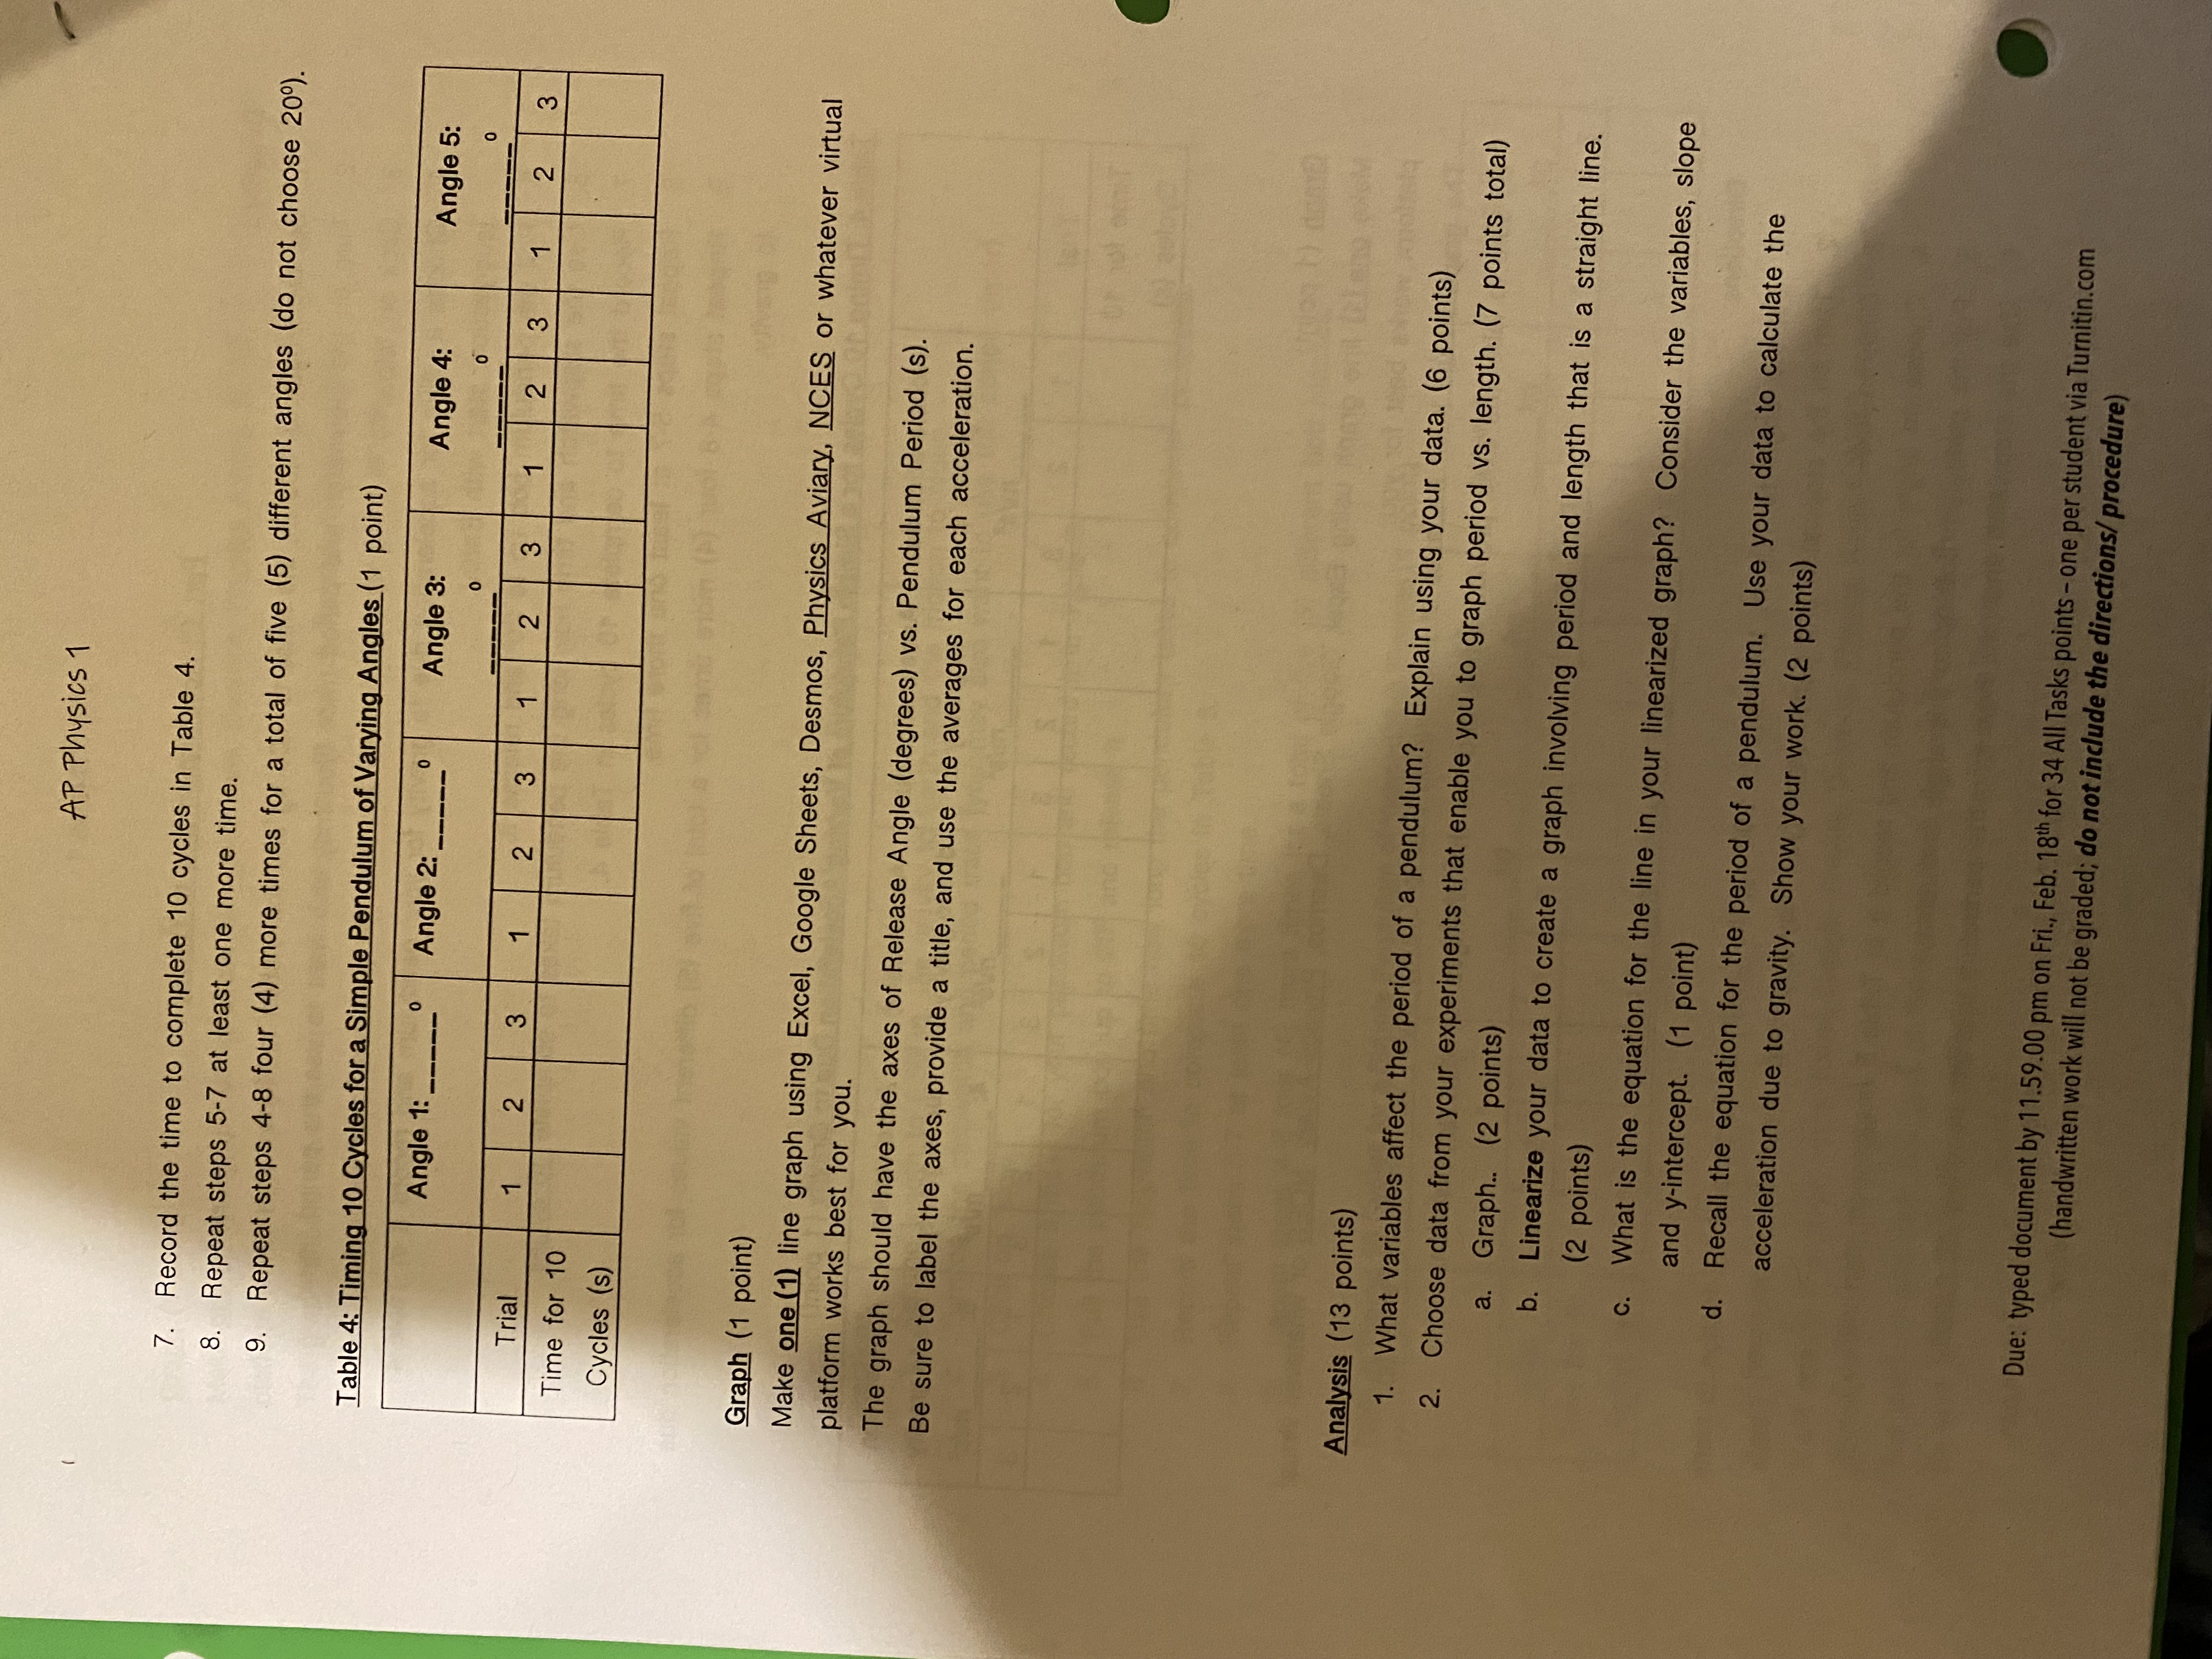
HOMEWORK - GUIDED PHET INQUIRY FOR SIMPLE PENDULUM PHET LINK: HTTPS://PHET.COLORADO.EDU/SIMS/HTML/PENDULUM-LAB/LATEST/PENDULUM-LAB_EN.HTML Part 1 - Energy in a Pendulum (13 points) Pendulum Lab Directions 1. Go to the PHET Pendulum lab and select "Lab". 2. On the right, leave Length, Mass, Gravity and Friction as set. Lab 3. At the bottom left, turn on the ruler and the timer. 4. At the top left, turn on the Energy Graph. 5. At the lower center, turn the speed to "Slow". 6. At the left, drag the ruler to the KE/PE bar graph. 7. Move the bob to an angle of your choice; this will be recorded in the table as + and - for the farthest right and farthest left, respectively. 8. Drag the stopwatch directly near the play button; this will 00:01.23 enable pressing the play button and starting the timer as close as possible. O Normal Slow 9. Press the play button and immediately start the timer. 10. As the pendulum swings, collect data on time and the height of both KE and PE bars at various locations and record in Table 1. 11. The PE and KE can be "measured" based on the ruler in cm (centimeters) as a substitute for energy in J (Joules). 12. For the data points except the "Bottom/ Center," fill in the angle. 13. Use the pause button as needed to record the necessary data. 14. Repeat the same experiment but change the length of the string from 0.70m to another length. Record your observations, as you will need this information to answer a later question. 15. Repeat the same initial experiment but change the mass of the bob from 1.00 kg to another mass. Record your observations, as you will need this information to answer a later question. 16. Repeat the same initial experiment but change the acceleration due to gravity from Earth to another value. Record your observations, as you will need this information to answer a later question. 17. Repeat the same initial experiment but change the friction from 0 to another value. Record your observations, as you will need this information to answer a later question. Due: typed document by 11.59.00 pm on Fri., Feb. 18th for 34 All Tasks points - one per student via Turnitin.com (handwritten work will not be graded; do not include the directions/ procedure)AP Physics 1 Table 1: Kinetic and Gravitational Potential Energy of a Simple Pendulum (1 point) Time (s) Kinetic Energy (cm) Gravitational Potential Location of Pendulum Bob Energy (cm) Farthest Right: + Bottom/ Center Farthest Left: - Data point 1: Data point 2: Data point 3: Data point 4: Graphs (2 points) Make two (2) line graphs using Excel, Google Sheets, Desmos, Physics Aviary, NCES or whatever virtual platform works best for you. The first line graph should be kinetic energy vs. time, and the second line graph on the same axes, should be gravitational potential energy vs. time. Be sure to label the axes, provide a title, and have different colors for the 2 graphs. Provide a key for which color is which energy. Analysis (10 points) 1. For the original/ initial experiment, at what point is (3 points total): a. the PE the greatest? b. the KE the greatest? c. v (velocity) the highest and the lowest? 2. For the original/ initial experiment, what is the relationship between KE and v? (1 point) 3. Look at your graph. If you were to add a third line, representing the sum of KE and PE at any given point, what would it look like? (1 point) 4. When you changed the length of the string, how did this affect the kinetic energy and gravitational potential energy? (1 point) Due: typed document by 11.59.00 pm on Fri., Feb. 18th for 34 All Tasks points - one per student via Turnitin.com (handwritten work will not be graded; do not include the directions/ procedure)AP Physics 1 5. When you changed the mass of the bob, how did this affect the kinetic energy and gravitational potential energy? (1 point) 6. When you changed the acceleration due to gravity, how did this affect the kinetic energy and gravitational potential energy? (1 point) 7. What happens to the motion of the pendulum as the total energy increases? (1 point) Part 2- Pendulum Variables as Related to the Period (21 points) For each part, you will need to calculate the period. You will need to use average values for time and then calculate the period. A period is the time for 1 cycle, but to reduce uncertainty's impact on your data, you will record for 10 cycles. This is not as significant of a correction in a virtual simulation, as you can artificially slow it down, but it would be essential in an actual experiment. Part A: Pendulum Length Directions 1. Set the mass to 1.00 kg, the gravity to Earth and the friction to None. 2. Turn on the stopwatch and period trace (you may also want to use the period timer). 3. Click on "slow." 4. Choose a length for your pendulum and record it in Table 2. 5. Pull the pendulum bob up to 20 and release it. 6. Use the stopwatch and time how long the pendulum takes to complete 10 cycles. 7. Record the time to complete 10 cycles in Table 2. 8. Repeat steps 5-7 at least one more time. 9. Repeat steps 4-8 four (4) more times for a total of five (5) different pendulum lengths. Table 2: Timing 10 Cycles for a Simple Pendulum of Varying Lengths (1 point) Length 1: Length 2: Length 3: Length 4: Length 5: m m m m m Trial 2 3 2 3 2 3 2 3 2 3 Time for 10 Cycles (s) Due: typed document by 17.59.00 pm on Fri., Feb. 18th for 34 All Tasks points - one per student via Turnitin.com (handwritten work will not be graded; do not include the directions/ procedure)Graph (1 point) Make one (1) line graph using Excel, Google Sheets, Desmos, Physics Aviary, NCES or whatever virtual platform works best for you. The graph should have the axes of Pendulum length (m) vs. Pendulum Period (s). Be sure to label the axes, provide a title, and use the averages for each length. Part B: Mass of a Pendulum Bob Directions 1. Set the length to 0.50 m, the gravity to Earth and the friction to None. 2. Turn on the stopwatch and period trace (you may also want to use the period timer). 3. Click on "slow." 4. Choose a mass for your pendulum bob and record it in Table 3. 5. Pull the pendulum bob up to 20 and release it. 6. Use the stopwatch and time how long the pendulum takes to complete 10 cycles. 7. Record the time to complete 10 cycles in Table 3. 8. Repeat steps 5-7 at least one more time. 9. Repeat steps 4-8 four (4) more times for a total of five (5) different bob masses. Table 3: Timing 10 Cycles for a Simple Pendulum of Varying Bob Masses (1 point) Mass 1: _kg Mass 2: Mass 3: Mass 4: Mass 5: kg Trial 2 3 2 3 2 3 2 3 2 3 Time for 10 Cycles (s) Graph (1 point) Make one (1) line graph using Excel, Google Sheets, Desmos, Physics Aviary, NCES or whatever virtual platform works best for you. The graph should have the axes of Pendulum mass (kg) vs. Pendulum Period (s). Be sure to label the axes, provide a title, and use the averages for each mass. Due: typed document by 11.59.00 pm on Fri., Feb. 18th for 34 All Tasks points - one per student via Turnitin.com (handwritten work will not be graded; do not include the directions/ procedure)Part C: Acceleration Due to Gravity Directions 1. Set the length to 1.00 m, the mass to 1.00 kg and the friction to None. 2. Turn on the stopwatch and period trace (you may also want to use the period timer). 3. Click on "slow." 4. Choose a value for acceleration due to gravity for your pendulum and record it in Table 4 (suggestion: start with Earth). 5. Pull the pendulum bob up to 20 and release it. 6. Use the stopwatch and time how long the pendulum takes to complete 10 cycles. 7. Record the time to complete 10 cycles in Table 4. 8. Repeat steps 5-7 at least one more time. 9. Repeat steps 4-8 four (4) more times for a total of five (5) different values for acceleration due to gravity. Table 4: Timing 10 Cycles for a Simple Pendulum of Varying Acceleration Due to Gravity (1 point) Acceleration due Acceleration due Acceleration Acceleration Acceleration to gravity 1: to gravity 2: due to gravity 3: due to gravity due to gravity m/s2 m/s2 m/s 4: m/s 5: m/s2 Trial 1 2 3 2 3 2 3 2 3 1 2 3 Time for 10 Cycles (s) Graph (1 point) Make one (1) line graph using Excel, Google Sheets, Desmos, Physics Aviary, NCES or whatever virtual platform works best for you. The graph should have the axes of Acceleration Due to Gravity (m/s2) vs. Pendulum Period (s). Be sure to label the axes, provide a title, and use the averages for each acceleration. Part D: Pendulum Angle of Release Directions 1. Set the length to 1.00 m, the mass to 1.00 kg, the gravity as Earth, and the friction to None. 2. Turn on the stopwatch and period trace (you may also want to use the period timer). 3. Click on "slow." 4. Choose an angle for the pendulum and record it in Table 5 (suggestion: start with 50). 5. Pull the pendulum bob up to this angle and release it. 6. Use the stopwatch and time how long the pendulum takes to complete 10 cycles. Due: typed document by 11.59.00 pm on Fri., Feb. 18th for 34 All Tasks points - one per student via Turnitin.com (handwritten work will not be graded; do not include the directions/ procedure)AP Physics 1 7. Record the time to complete 10 cycles in Table 4. 8. Repeat steps 5-7 at least one more time. 9. Repeat steps 4-8 four (4) more times for a total of five (5) different angles (do not choose 209). Table 4: Timing 10 Cycles for a Simple Pendulum of Varying Angles (1 point) Angle 1: Angle 2: Angle 3: Angle 4: Angle 5: Trial 1 2 3 2 3 2 3 2 3 1 2 3 Time for 10 Cycles (s) Graph (1 point) Make one (1) line graph using Excel, Google Sheets, Desmos, Physics Aviary, NCES or whatever virtual platform works best for you. The graph should have the axes of Release Angle (degrees) vs. Pendulum Period (s). Be sure to label the axes, provide a title, and use the averages for each acceleration. Analysis (13 points) 1. What variables affect the period of a pendulum? Explain using your data. (6 points) 2. Choose data from your experiments that enable you to graph period vs. length. (7 points total) a. Graph.. (2 points) b. Linearize your data to create a graph involving period and length that is a straight line. (2 points) c. What is the equation for the line in your linearized graph? Consider the variables, slope and y-intercept. (1 point) d. Recall the equation for the period of a pendulum. Use your data to calculate the acceleration due to gravity. Show your work. (2 points) Due: typed document by 11.59.00 pm on Fri., Feb. 18th for 34 All Tasks points - one per student via Turnitin.com (handwritten work will not be graded; do not include the directions/ procedure)
Step by Step Solution
There are 3 Steps involved in it

Get step-by-step solutions from verified subject matter experts