

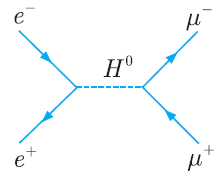
Question: In our discussion of the reaction e + + e μ + + μ , we completely neglected the Higgs exchange diagram of Figure 10.30,
Figure 10.2
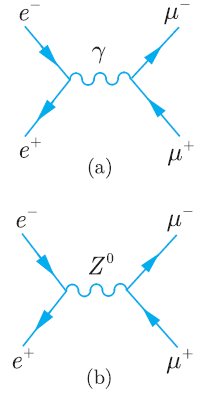
Figure 10.30
e+ " (a) Z e+ (b)
Step by Step Solution
★★★★★
3.46 Rating (169 Votes )
There are 3 Steps involved in it
1 Expert Approved Answer
Step: 1 Unlock

From 1017 at E CM 2E M H we have Because the Higgs boson has spin zero the B... View full answer
Question Has Been Solved by an Expert!
Get step-by-step solutions from verified subject matter experts
Step: 2 Unlock
Step: 3 Unlock