

Question: The sequence in Figure P2.2 represents a ball rolling into a wall and bouncing off of it. The ball is (10 mathrm{~mm}) in diameter. Make
The sequence in Figure P2.2 represents a ball rolling into a wall and bouncing off of it. The ball is \(10 \mathrm{~mm}\) in diameter. Make a graph showing the distance from the leading edge of the ball to the closest part of the wall (using the wall as the origin) as it changes from frame to frame.
Data from Figure P2.2
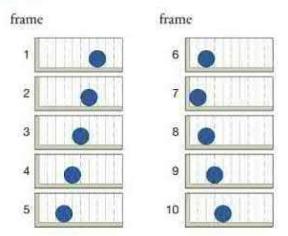
frame frame 2 6 3 8 5 10
Step by Step Solution
★★★★★
3.34 Rating (151 Votes )
There are 3 Steps involved in it
1 Expert Approved Answer
Step: 1 Unlock

Question Has Been Solved by an Expert!
Get step-by-step solutions from verified subject matter experts
Step: 2 Unlock
Step: 3 Unlock