

The diagram shows the curve with equation y = (x 2) ln x + 1, x
Question:
The diagram shows the curve with equation y = (x − 2) ln x + 1, x > 0.
a. Complete the table with the values of y corresponding to x = 2 and x = 2.5.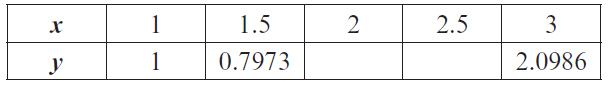
Given that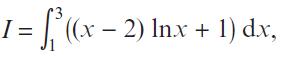
b. Use the trapezium rule
i. With values of y at x = 1, 2 and 3 to find an approximate value for I, giving your answer to 4 significant figures.
ii. With values of y at x = 1, 1.5, 2, 2.5 and 3 to find another approximate value for I, giving your answer to 4 significant figures.
c. Use the diagram to explain why an increase in the number of values improves the accuracy of the approximation.
d. Show by integration, that the exact value of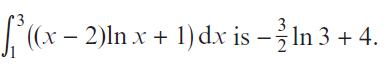
Fantastic news! We've Found the answer you've been seeking!
Step by Step Answer:
a y x 2 ln x 1 x 0 for x 2 y 0 for x 25 y 25 2 ln 25 1 05 ln 25 1 14581 b Applying the Trapezoidal R...View the full answer

Answered By
Ankit Jangra
Career Summary: Over twenty five years of teaching experience, more than half of which in Engineering subjects and a significant half in MBA entrance level exams. Here is a short gist.
Work Experience: Alumni of a national institute of technology in computer science and an IIM (a prestigious management institute in India and globally) call getter (98.7 percentile).
Had also been a project guide on one occasion for a Engineering final year project in designing a Network Intrusion Detection System, an advanced firewall mechanism that dealt with network security. Have also designed many software projects from games to online payment to network data transfer format and interchange.
Have also written three university level text book notes on C and Data Structure, Digital circuits and Engineering Mathematics.
Had been teaching and mentoring MBA aspirants in reputed institutes of the country.
Associated with an academy for the last seven years teaching subjects like Aptitude, C and Data Structure, Analysis of Algorithm, Operating System, Digital Circuits for post graduate entrance exams and also had the privilege of being a guest lecturer in many government universities across the country.
Computer Literacy: Have detailed and intricate and extensive knowledge of Core Java, Enterprise Java, React, Spring Framework, Hibernate, LDAP (server directory structure) and Scala Actor System and Databases like MySql, Mongodb, PostgreSql. Teaching Java fundamentals from basic to advanced, from Java Memory model to Reference objects, to UTC Date Time format, to responsive Java, to design patterns, to JUnit test, to ForkJoin thread pool, only a few samples to count. Only recently, (for academic interest) designed a Json converter (Json to Java object and vice versa) from scratch like Jackson, for mongoDB application. Also designing web applications both front and backend, with knowledge of React, HTML, CSS, Javascript. Have been teaching Java for more than seven years.
0 Reviews
10+ Question Solved
Related Book For 
Pearson Edexcel A Level Mathematics Pure Mathematics Year 2
ISBN: 9781292183404
1st Edition
Authors: Greg Attwood, Jack Barraclough, Ian Bettison, David Goldberg, Alistair Macpherson, Joe Petran
Question Posted:
