

Question: The curve with equation y = e 2x e x , 0 x 1, is shown in the diagram. The finite region
The curve with equation y = e2x − e−x, 0 ≤ x ≤ 1, is shown in the diagram. The finite region enclosed by the curve, the x-axis and the line x = 1 is shaded. The table below shows the corresponding values of x and y with the y values given to 5 decimal places as appropriate.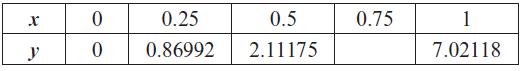
a. Complete the table with the missing value for y. Give your answer to 5 decimal places.
b. Use the trapezium rule, with all the values of y in the table, to obtain an estimate for the area of R, giving your answer to 4 decimal places.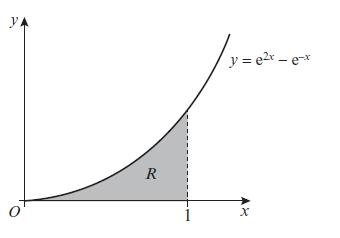
c. State, with a reason, whether your answer to part b is an overestimate or an underestimate.
d. Use integration to find the exact value of R. Write your answer in the form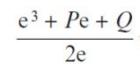
e. Find the percentage error in the answer to part b.
X y 0 0 0.25 0.86992 0.5 2.11175 0.75 1 7.02118
Step by Step Solution
3.36 Rating (162 Votes )
There are 3 Steps involved in it
a 400932 c b 26254 ... View full answer

Get step-by-step solutions from verified subject matter experts