

A PT phase diagram for potassium is shown below. a. Which phase has the higher density, the
Question:
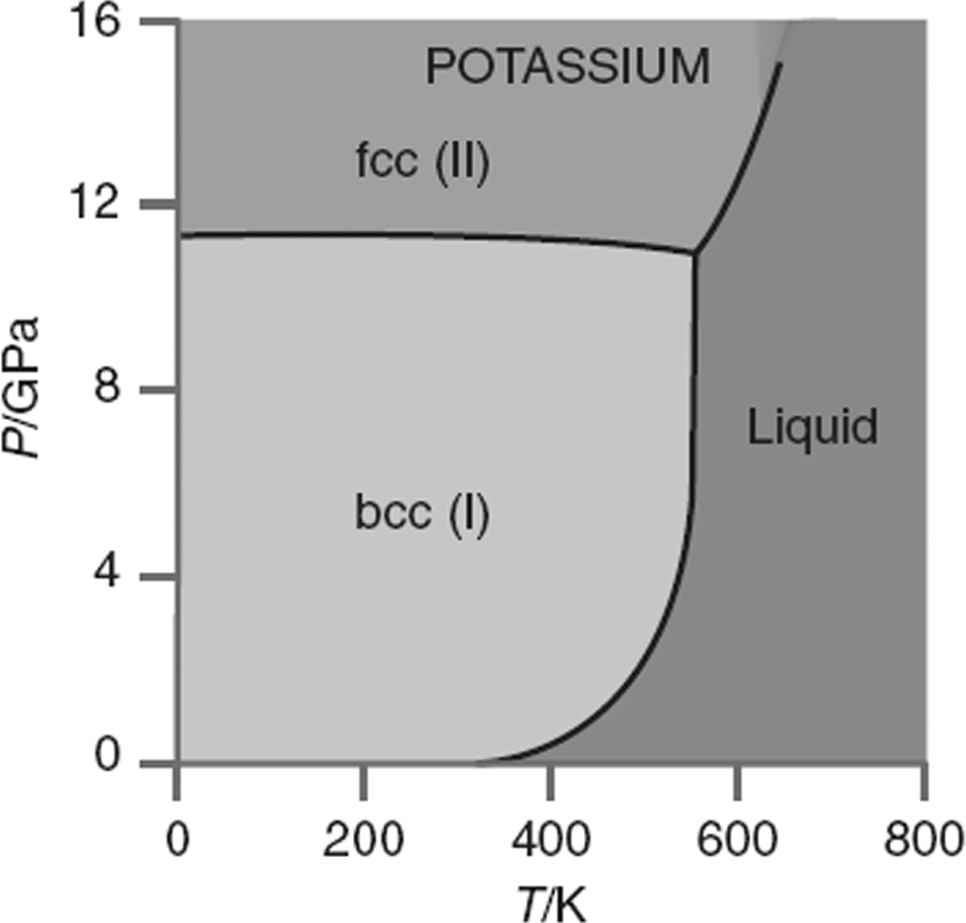
a. Which phase has the higher density, the fcc or the bcc phase? Explain your answer.
b. Indicate the range of P and T in the phase diagram for which fcc and liquid potassium are in equilibrium. Does fcc potassium float on or sink in liquid potassium? Explain your answer.
c. Redraw this diagram for a different pressure range and indicate where you expect to find the vapor phase. Explain how you chose the slope of your liquid€“vapor coexistence line.
Fantastic news! We've Found the answer you've been seeking!
Step by Step Answer:
a According to Le Chateliers principle for a given temperature the phase with the high...View the full answer

Answered By
PALASH JHANWAR
I am a Chartered Accountant with AIR 45 in CA - IPCC. I am a Merit Holder ( B.Com ). The following is my educational details.
PLEASE ACCESS MY RESUME FROM THE FOLLOWING LINK: https://drive.google.com/file/d/1hYR1uch-ff6MRC_cDB07K6VqY9kQ3SFL/view?usp=sharing
3+ Reviews
10+ Question Solved
Related Book For 

Question Posted:
