

Question: In this problem you will use a spreadsheet to create a Txy diagram for the benzene-chloroform system at 1 atm. Once the spreadsheet has been
In this problem you will use a spreadsheet to create a Txy diagram for the benzene-chloroform system at 1 atm. Once the spreadsheet has been created, it can be used as a template for vapor–liquid equilibrium calculations for other species. The calculations will be based on Raoult’s law (i.e., yiP = xip∗i), although we recognize that this relationship may not produce accurate results for benzene-chloroform mixtures.
(a) Begin by establishing bounds on the system behavior. Look up the normal boiling points of chloroform and benzene and, without performing any calculations, sketch the expected shape of a Txy diagram for these two species at 1 atm.
(b) Using APEx or Table B.4, estimate the normal boiling points of the two species and compare them to the results in Part (a).
c) Prepare a spreadsheet that has a title row “Txy Diagram for Ideal Binary Solution of Chloroform and Benzene.” In the first cell of Row 2, place the label “P (mm Hg) =” and in the adjacent cell enter the system pressure, which for this case is 760. In Row 3 place headings for columns: xC, xB, T, p*C, p*B, P, yC, yB, and yC = yB. Not all of these columns are essential, but when filled they will give a complete picture of the system and a final check of the calculations. Carry out the following procedures in each subsequent row:
• Enter values for the mole fraction of chloroform (the first entry should be 1.000 and the last should be 0.000).
• Calculate the mole fraction of benzene by subtracting the value in the previous cell from 1.000.
• Enter an estimate of the equilibrium temperature that is between the two pure-component boiling points. • Use APEx or Table B.4 to estimate p*C and p*B from the estimated temperature.
• Calculate pC and pB from Raoult’s law.
• Calculate P = pC = pB and apply the Goal Seek tool to adjust the value of T until P = 760 mm Hg.
• Calculate yC and yB from the partial pressures and P.
• Sum yC and yB to be sure they equal 1.000.
Once you have completed a row for the first value of xC, you should be able to copy formulas into subsequent rows. When the calculation has been completed for all rows (i.e., xC = 0:0, 0.2, 0.4, 0.5, 0.6, 0.8, 1.0), draw the Txy diagram.
(d) Explain what you did in the bulleted sequence of steps in Part (c) giving relevant relationships among system variables. The phrase “bubble point” should appear in your explanation.
(e) The following vapor–liquid equilibrium data have been obtained for mixtures of chloroform (C) and benzene (B) at 1 atm.
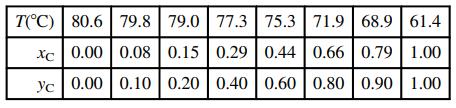
Plot these data on the graph generated in Part (c). Estimate the percentage errors in the Raoult’s law values of the bubble-point temperature and vapor mole fraction for xC = 0.44, taking the tabulated values to be correct. Why does Raoult’s law give poor estimates for this system?
T(C) | 80.6 | 79.8 79.0 77.3 75.3 71.9 68.9 | 61.4 xc 0.00 | 0.08 0.15 0.29 0.44 0.66 | 0.79 1.00 yc 0.00 | 0.10 0.20 0.40 0.60 | 0.80 0.90 1.00
Step by Step Solution
3.41 Rating (157 Votes )
There are 3 Steps involved in it
a The expected shape of a Txy diagram for the benzenechloroform system at 1 atm can be sketched as a positive azeotrope A positive azeotrope is a type ... View full answer

Get step-by-step solutions from verified subject matter experts