

Question: Assuming that the two trajectories in the diagram for question 23 represent throws by two different center fielders, which of the two is likely to
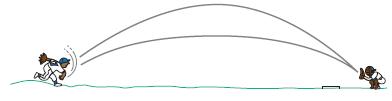
Assuming that the two trajectories in the diagram for question 23 represent throws by two different center fielders, which of the two is likely to have been thrown by the player with the stronger arm? Explain.
Data From Question 23
In the diagram, two different trajectories are shown for a ball thrown by a center fielder to home plate in a baseball game. Which of the two trajectories (if either), the higher one or the lower one, will result in a longer time for the ball to reach home plate? Explain.
Step by Step Solution
3.36 Rating (171 Votes )
There are 3 Steps involved in it
The figure is not loading but i will try to give best answer the range for the projectile motion i... View full answer

Get step-by-step solutions from verified subject matter experts