

Question: During the project execution you run a program for some parameters and draw a bell curve as shown in the figure below. After analyzing this
During the project execution you run a program for some parameters and draw a bell curve as shown in the figure below. After analyzing this figure, you come to the conclusion that: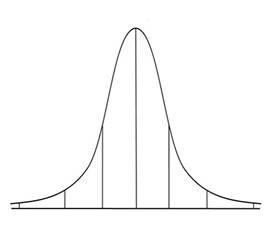
(a) The process is too risky
(b) The process is not too risky
(c) The data is in sufficient
(d) The process is under control
Step by Step Solution
There are 3 Steps involved in it
1 Expert Approved Answer
Step: 1 Unlock

Question Has Been Solved by an Expert!
Get step-by-step solutions from verified subject matter experts
Step: 2 Unlock
Step: 3 Unlock