

Question: Amazon.com is an e-commerce firm that has shown considerable growth since its founding in 1995, and its quarterly net sales are shown in Table 14.4.4.
Amazon.com is an e-commerce firm that has shown considerable growth since its founding in 1995, and its quarterly net sales are shown in Table 14.4.4. Their 2014 annual report includes a section titled “Seasonality” that states: “Our business is affected by seasonality, which historically has resulted in higher sales volume during our fourth quarter, which ends Dec. 31. We recognized 33%, 34%, and 35% of our annual revenue during the fourth quarter of 2014, 2013, and 2012.”
a. Construct a time-series plot for this data set. Do you agree that there are seasonal factors present here?
b. Calculate the moving average (using 1 year of data at a time) for this time series. Construct a time-series plot with both the data and the moving average.
c. Describe any cyclic behavior that you see in the moving average.
d. Find the seasonal index for each quarter. Do these values appear reasonable when you look at the time-series plot of the data?
e. Which is Amazon.com’s best quarter (1, 2, 3, or 4)? On average, how much higher are sales then as compared to a typical quarter during the year?
f. Which is Amazon.com’s worst quarter (1, 2, 3, or 4)? On average, how much lower are sales then as compared to a typical quarter during the year?
g. Find the seasonally adjusted sales corresponding to each of the original sales values. Construct a timeseries plot of this seasonally adjusted series.
h. Describe the behavior of the seasonally adjusted series. In particular, identify any variations in growth rate that are visible over this time period.
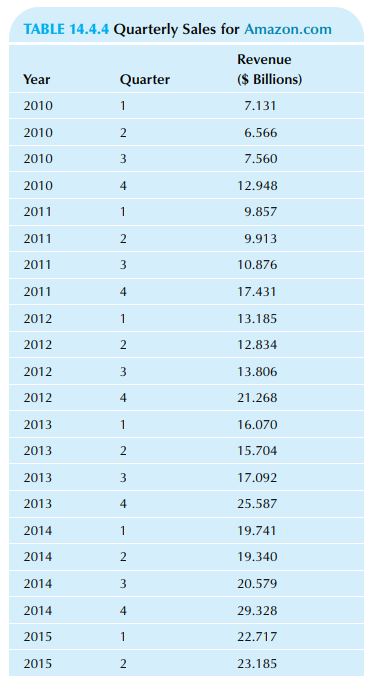
TABLE 14.4.4 Quarterly Sales for Amazon.com Revenue ($ Billions) Year Quarter 2010 1 7.131 2010 2 6.566 2010 7.560 2010 4 12.948 2011 9.857 2011 9.913 2011 3 10.876 2011 4 17.431 2012 13.185 2012 12.834 2012 13.806 2012 4 21.268 2013 16.070 2013 15.704 2013 3 17.092 2013 4 25.587 2014 1 19.741 2014 2 19.340 2014 20.579 2014 4 29.328 2015 22.717 1 23.185 2015
Step by Step Solution
3.44 Rating (170 Votes )
There are 3 Steps involved in it
a Yes there are strong seasonal patterns here with sales consistently rising to the fourth quarter a... View full answer

Get step-by-step solutions from verified subject matter experts