Consider PepsiCos quarterly net revenue as shown in Table 14.4.5. a. Draw a time-series plot for this
Question:
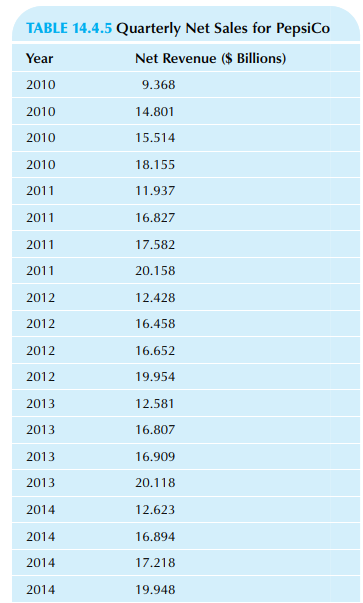
Consider PepsiCo’s quarterly net revenue as shown in Table 14.4.5.
a. Draw a time-series plot for this data set. Describe any trend and seasonal behavior that you see.
b. Plot the moving average values on the same graph as the original data. Comment on what you see.
c. Find the seasonal index for each quarter. Which is generally the best quarter for PepsiCo? About how much larger are net sales in this quarter, as compared to a typical quarter?
d. Plot the seasonally adjusted series with the original data. e. Find the regression equation to predict the long-term trend in seasonally adjusted sales for each time period, using 1, 2,… for the X variable.
f. Does PepsiCo show a significant trend (either up or down) over this time period as indicated by the regression analysis in the previous part of this problem?
g. If we omit the first year (the four observations in 2010) but still use the other seasonally adjusted values as we did in the previous regression, does PepsiCo show a significant trend (either up or down) over this time period?
Step by Step Answer:
a There is no clear trend either up or down perhaps there is an upward trend near the start but it d...View the full answer