

Question: Using the data from Table 2.6.7 of Chapter 2 for the 30 Dow Jones Industrial companies percent changes since January 2015: a. Find the mean
Using the data from Table 2.6.7 of Chapter 2 for the 30 Dow Jones Industrial companies percent changes since January 2015:
a. Find the mean percent change.
b. Find the median percent change.
c. Find the five-number summary for percent change.
d. Draw the box plot for percent change.
e. Draw the cumulative distribution function for percent change.
f. Find the percentile of a data value of 5% and the data value of the 80th percentile for percent change.
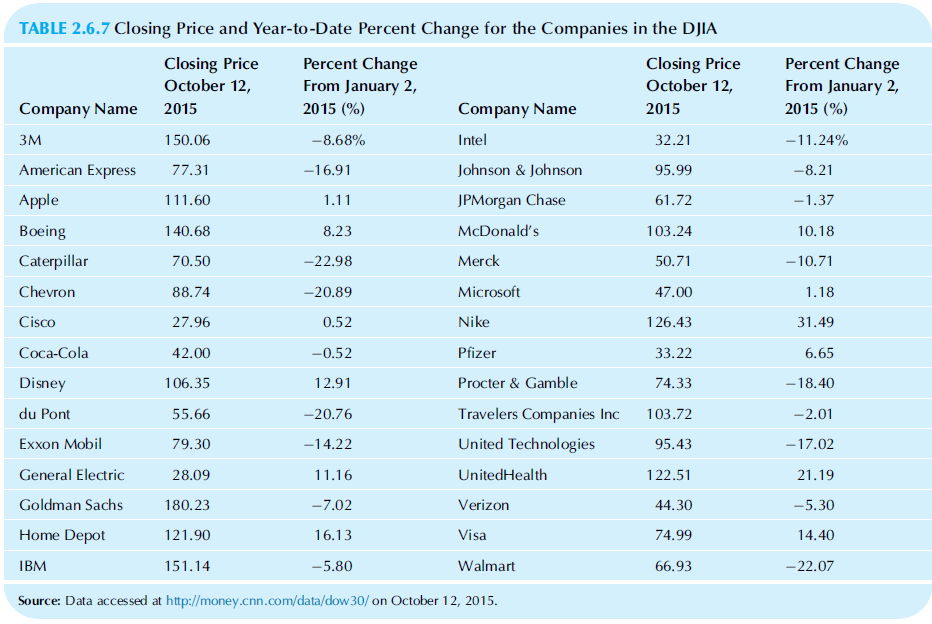
TABLE 2.6.7 Closing Price and Year-to-Date Percent Change for the Companies in the DJIA Percent Change From January 2, Closing Price October 12, Percent Change From January 2, Closing Price October 12, Company Name Company Name 2015 (%) 2015 2015 (%) 2015 Intel 150.06 -8.68% -11.24% 32.21 Johnson & Johnson American Express 77.31 -8.21 -16.91 95.99 JPMorgan Chase Apple 1.11 -1.37 111.60 61.72 Boeing McDonald's 10.18 140.68 8.23 103.24 Merck Caterpillar 70.50 -22.98 50.71 -10.71 Chevron Microsoft 1.18 88.74 -20.89 47.00 Cisco Nike 31.49 27.96 0.52 126.43 Coca-Cola Pfizer 6.65 42.00 -0.52 33.22 Disney 106.35 Procter & Gamble -18.40 12.91 74.33 du Pont -20.76 Travelers Companies Inc 103.72 -2.01 55.66 Exxon Mobil United Technologies -17.02 79.30 -14.22 95.43 UnitedHealth General Electric 122.51 21.19 28.09 11.16 Goldman Sachs Verizon 180.23 -7.02 44.30 -5.30 Home Depot 121.90 Visa 16.13 74.99 14.40 Walmart IBM 151.14 -5.80 -22.07 66.93 Source: Data accessed at http://money.cnn.com/data/dow30/ on October 12, 2015.
Step by Step Solution
3.28 Rating (172 Votes )
There are 3 Steps involved in it
a The average is 263 b The median is 366 c ... View full answer

Get step-by-step solutions from verified subject matter experts