

Question: Using the data from Table 2.6.8 of Chapter 2 for daily values for the Dow Jones Industrial Average: a. Find the mean net change. b.
Using the data from Table 2.6.8 of Chapter 2 for daily values for the Dow Jones Industrial Average:
a. Find the mean net change.
b. Find the median net change.
c. Find the five-number summary for net change.
d. Draw a box plot for net change.
e. Find the mean percent change.
f. Find the median percent change.
g. Find the five-number summary for percent change.
h. Draw a box plot for percent change.
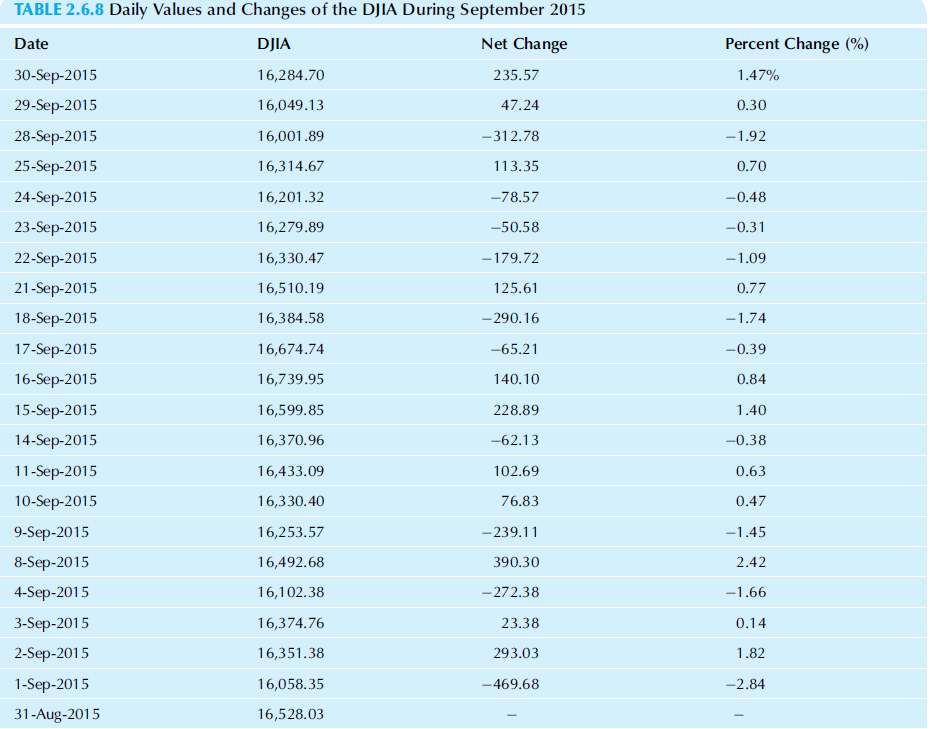
TABLE 2.6.8 Daily Values and Changes of the DJIA During September 2015 Net Change Percent Change (%) Date DJIA 30-Sep-2015 1.47% 16,284.70 235.57 29-Sep-2015 16,049.13 47.24 0.30 28-Sep-2015 -312.78 -1.92 16,001.89 25-Sep-2015 16,314.67 113.35 0.70 24-Sep-2015 -0.48 16,201.32 -78.57 23-Sep-2015 -0.31 16,279.89 -50.58 22-Sep-2015 -179.72 16,330.47 -1.09 21-Sep-2015 125.61 0.77 16,510.19 18-Sep-2015 -1.74 16,384.58 -290.16 17-Sep-2015 -65.21 16,674.74 -0.39 16-Sep-2015 140.10 0.84 16,739.95 228.89 15-Sep-2015 16,599.85 1.40 14-Sep-2015 -62.13 16,370.96 -0.38 11-Sep-2015 102.69 16,433.09 0.63 10-Sep-2015 16,330.40 76.83 0.47 9-Sep-2015 16,253.57 -239.11 -1.45 8-Sep-2015 16,492.68 390.30 2.42 4-Sep-2015 16,102.38 -272.38 -1.66 3-Sep-2015 0.14 16,374.76 23.38 2-Sep-2015 16,351.38 293.03 1.82 1-Sep-2015 -2.84 16,058.35 -469.68 31-Aug-2015 16,528.03
Step by Step Solution
3.45 Rating (168 Votes )
There are 3 Steps involved in it
a The mean net change is 116 b The median net change is 234 c ... View full answer

Get step-by-step solutions from verified subject matter experts