

Question: What distribution shape is represented by the histogram in Fig. 3.8.1 of voltages measured for incoming components as part of a quality control program? Fig
What distribution shape is represented by the histogram in Fig. 3.8.1 of voltages measured for incoming components as part of a quality control program?
Fig 3.8.1
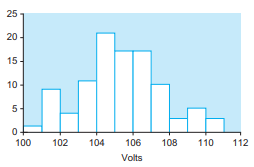
25 20 15 10 5- 100 102 104 106 108 110 112 Volts
Step by Step Solution
★★★★★
3.40 Rating (172 Votes )
There are 3 Steps involved in it
1 Expert Approved Answer
Step: 1 Unlock

Question Has Been Solved by an Expert!
Get step-by-step solutions from verified subject matter experts
Step: 2 Unlock
Step: 3 Unlock