

Question: What distribution shape is represented by the histogram in Fig. 3.8.2 of profit margins for consumer products? Figure 3.8.2 50 40 30 20 10 20
What distribution shape is represented by the histogram in Fig. 3.8.2 of profit margins for consumer products?
Figure 3.8.2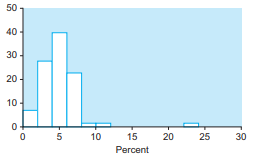
50 40 30 20 10 20 10 15 25 30 Percent
Step by Step Solution
★★★★★
3.47 Rating (160 Votes )
There are 3 Steps involved in it
1 Expert Approved Answer
Step: 1 Unlock

Approxi... View full answer
Question Has Been Solved by an Expert!
Get step-by-step solutions from verified subject matter experts
Step: 2 Unlock
Step: 3 Unlock