

Question: In Example 7.1, two points on the demand curve were given (Figure 7.11). a. Suppose three additional points are estimated by Madison: (1) demand of
In Example 7.1, two points on the demand curve were given (Figure 7.11).
a. Suppose three additional points are estimated by Madison: (1) demand of 460 when price is $65, (2) demand of 355 when price is $75, and (3) demand of 275 when price is $85. With these new points and the original two points, estimate and interpret the best-fitting linear demand curve; do the same for the best-fitting constant elasticity demand curve.
b. Calculate the mean absolute percentage error (MAPE) for each of the two fits, linear and constant elasticity, where each MAPE is the average of the absolute percentage errors for the five points. On the basis of MAPE, which curve provides the better fit?
Figure 7.11:
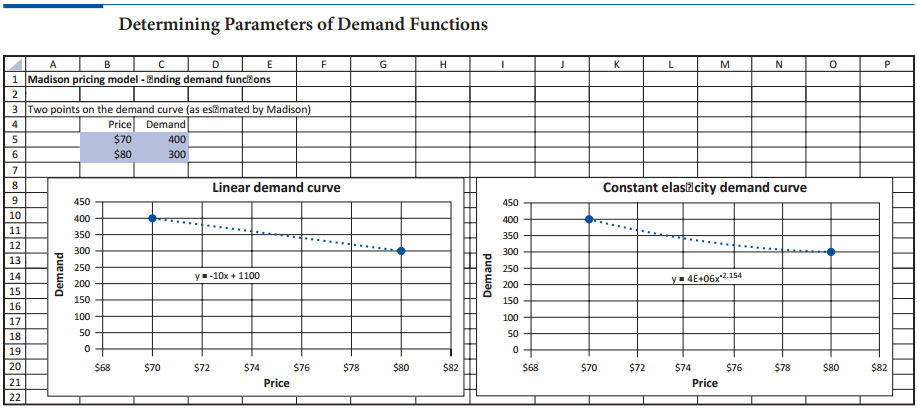
Determining Parameters of Demand Functions A 1 Madison pricing model - Ending demand funczons 3 Two points on the demand curve (as esamated by Madison) Price Demand $70 $80 400 6. 300 Linear demand curve Constant elascity demand curve 450 450 10 400 400 11 350 350 12 300 300 13 250 250 14 y--10x + 1100 y= 4E+06x2.154 200 200 15 150 150 16 100 100 17 50 50 18 19 20 $68 $70 $72 $74 $76 $78 $80 $82 $68 $70 $72 $74 $76 $78 $80 $82 21 Price Price 22 Demand ---- Demand
Step by Step Solution
3.30 Rating (165 Votes )
There are 3 Steps involved in it
Demand Functions Madison pricing model finding demand functions Two ... View full answer

Get step-by-step solutions from verified subject matter experts