Question: 1. In Example 7.1, two points on the demand curve were given (see Figure 7.11). a. Suppose three additional points are estimated by Madison: (1)
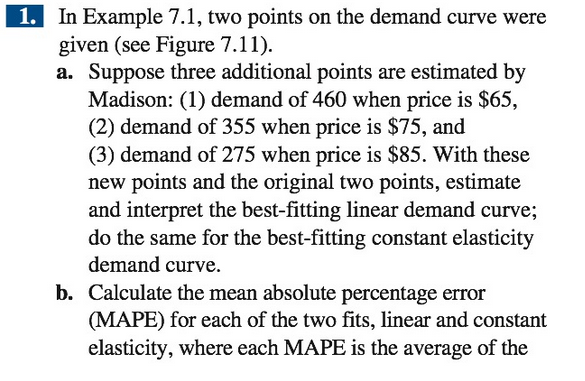
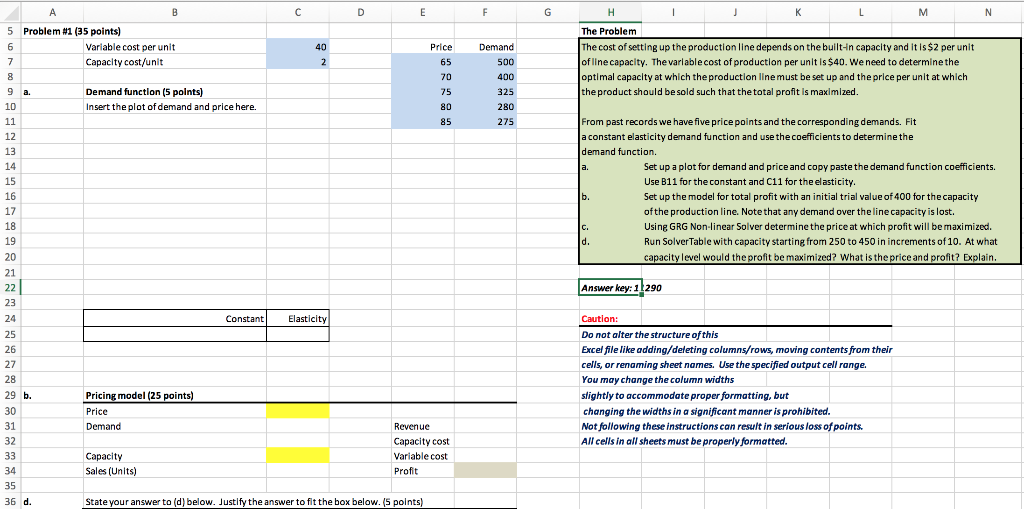
1. In Example 7.1, two points on the demand curve were given (see Figure 7.11). a. Suppose three additional points are estimated by Madison: (1) demand of 460 when price is $65, (2) demand of 355 when price is $75, and (3) demand of 275 when price is $85. With these new points and the original two points, estimate and interpret the best-fitting linear demand curve; do the same for the best-fitting constant elasticity demand curve. b. Calculate the mean absolute percentage error (MAPE) for each of the two fits, linear and constant elasticity, where each MAPE is the average of the absolute percentage errors for the five points. On the basis of MAPE, which curve provides the better fit? N 5 Problem #1 (35 points) Variable cost per unit Capacity cost/unit 40 Price Demand J K L M The Problem The cost of setting up the production line depends on the built-in capacity and it is $2 per unit of line capacity. The variable cost of production per unit is $40. We need to determine the optimal capacity at which the production line must be set up and the price per unit at which the product should be sold such that the total profit is maximized. 500 Demand function (5 points) Insert the plot of demand and price here. 400 325 280 275 From past records we have five price points and the corresponding demands. Fit a constant elasticity demand function and use the coefficients to determine the demand function. Set up a plot for demand and price and copy paste the demand function coefficients. Use B11 for the constant and C11 for the elasticity. Set up the model for total profit with an initial trial value of 400 for the capacity of the production line. Note that any demand over the line capacity is lost. Using GRG Non-linear Solver determine the price at which profit will be maximized. Run Solver Table with capacity starting from 250 to 450 in increments of 10. At what capacity level would the profit be maximized? What is the price and profit? Explain. Answer key: 1290 Constant Elasticity Caution: Do not alter the structure of this Excel file like adding/deleting columns/rows, moving contents from their cells, or renaming sheet names. Use the specified output cell range. You may change the column widths slightly to accommodate proper formatting, but changing the widths in a significant manner is prohibited. Not following these instructions can result in serious loss of points. All cells in all sheets must be properly formatted. Pricing model (25 points) Price Demand Revenue Capacity cost Variable cost Profit Capacity Sales (Units) State your answer to (d) below. Justify the answer to fit the box below. (5 points) 1. In Example 7.1, two points on the demand curve were given (see Figure 7.11). a. Suppose three additional points are estimated by Madison: (1) demand of 460 when price is $65, (2) demand of 355 when price is $75, and (3) demand of 275 when price is $85. With these new points and the original two points, estimate and interpret the best-fitting linear demand curve; do the same for the best-fitting constant elasticity demand curve. b. Calculate the mean absolute percentage error (MAPE) for each of the two fits, linear and constant elasticity, where each MAPE is the average of the absolute percentage errors for the five points. On the basis of MAPE, which curve provides the better fit? N 5 Problem #1 (35 points) Variable cost per unit Capacity cost/unit 40 Price Demand J K L M The Problem The cost of setting up the production line depends on the built-in capacity and it is $2 per unit of line capacity. The variable cost of production per unit is $40. We need to determine the optimal capacity at which the production line must be set up and the price per unit at which the product should be sold such that the total profit is maximized. 500 Demand function (5 points) Insert the plot of demand and price here. 400 325 280 275 From past records we have five price points and the corresponding demands. Fit a constant elasticity demand function and use the coefficients to determine the demand function. Set up a plot for demand and price and copy paste the demand function coefficients. Use B11 for the constant and C11 for the elasticity. Set up the model for total profit with an initial trial value of 400 for the capacity of the production line. Note that any demand over the line capacity is lost. Using GRG Non-linear Solver determine the price at which profit will be maximized. Run Solver Table with capacity starting from 250 to 450 in increments of 10. At what capacity level would the profit be maximized? What is the price and profit? Explain. Answer key: 1290 Constant Elasticity Caution: Do not alter the structure of this Excel file like adding/deleting columns/rows, moving contents from their cells, or renaming sheet names. Use the specified output cell range. You may change the column widths slightly to accommodate proper formatting, but changing the widths in a significant manner is prohibited. Not following these instructions can result in serious loss of points. All cells in all sheets must be properly formatted. Pricing model (25 points) Price Demand Revenue Capacity cost Variable cost Profit Capacity Sales (Units) State your answer to (d) below. Justify the answer to fit the box below. (5 points)


