

Question: This is an extension of Case 2.1 from Chapter 2, so you should read that case first. It asks you to develop a spreadsheet model,
This is an extension of Case 2.1 from Chapter 2, so you should read that case first. It asks you to develop a spreadsheet model, using a 0-1 variable for each potential project, so that Cliff Erland, Manager for Project Development, can easily see the implications of approving any set of projects. Cliff would now like you to find the optimal-set of projects to approve. However, the projects are no longer of the "all or nothing" variety. The partnership percentages given in Table 2.2 of Chapter 2 should now be interpreted as the maximum levels Ewing can enter in the projects. For example, the 50% for project 3 indicates that Ewing can enter into any level of that project from 0% to 50%. The corresponding capital expenditures and NPVs in Table 2.2 should then be multiplied by the percentage levels chosen. Because of this change in the problem, you should change the constraints on promises to the functional areas. Instead of promising each functional area at least one approved project, the model should now promise them at least one project at a level of at least 75%.
Starting with the spreadsheet model developed in Case 2.1, you should modify it to optimize the total NPV by choosing the levels of each project, subject to the constraints indicated. These constraints include the following: (1) the total budget of $10 billion for all three years; (2) the budget of $4 billion in any single year; (3) the promise to the functional areas; and (4) the upper limits on the project levels.
Cliff is no expert on optimization models, but he suspects that the promise to the functional areas will lead to a non-smooth problem. If you agree, then feel free to use Evolutionary Solver rather than the LP Simplex method. As always, it will take longer, but it might be necessary.
Given the optimal solution you find, provide a realistic recommendation to Cliff about what the company should do.
Table 2.2:
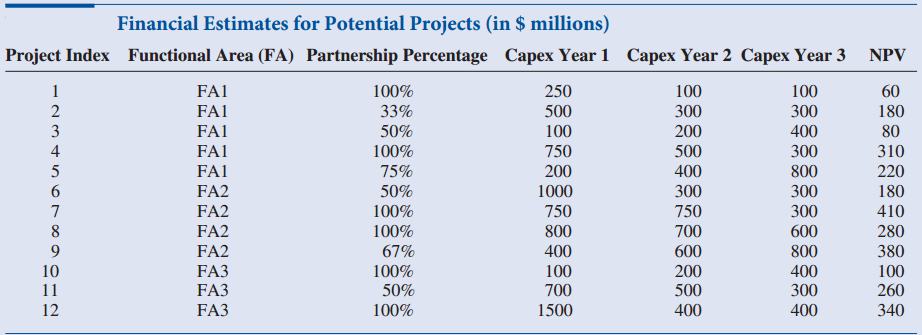
Financial Estimates for Potential Projects (in $ millions) Project Index Functional Area (FA) Partnership Percentage Capex Year 1 Capex Year 2 Capex Year 3 NPV 60 FA1 100% 250 100 100 500 300 FA1 33% 300 180 80 310 220 3 4 100 FA1 50% 200 500 400 400 FA1 100% 75% 750 300 FA1 FA2 200 800 1000 180 410 50% 300 300 750 FA2 100% 750 300 FA2 FA2 FA3 FA3 FA3 100% 800 700 600 280 380 800 400 300 67% 400 600 100 260 10 11 100% 100 200 700 50% 500 340 12 100% 1500 400 400
Step by Step Solution
3.32 Rating (158 Votes )
There are 3 Steps involved in it
Model Project Selection at Ewing Natural Gas Inputs All values in S millions assuming 100 involvemen... View full answer

Get step-by-step solutions from verified subject matter experts
Document Format (1 attachment)
1497_603f29ab84acb_695316.xlsx
300 KBs Excel File