

A member of a track team was practicing the long jump and recorded the distances (in centimeters)
Question:
A member of a track team was practicing the long jump and recorded the distances (in centimeters) shown in the dotplot. Some numerical summaries of the data are also provided.
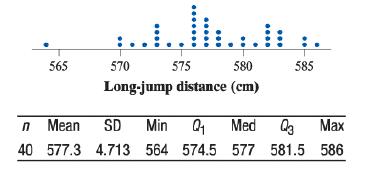
After chatting with a teammate, the jumper realized that he measured his jumps from the back of the board instead of the front. Thus, he had to subtract 20 centimeters from each of his jumps to get the correct measurement for each jump.
a. What shape would the distribution of corrected long jump distance have?
b. Find the mean and median of the distribution of corrected longjump distance.
c. Find the standard deviation and interquartile range (IQR) of the distribution of corrected long-jump distance.
Fantastic news! We've Found the answer you've been seeking!
Step by Step Answer:
Solution n40 u5773 sigma4713 ...View the full answer

Answered By
GUTTA TEJASWI
PRESENT I AM WORKIND AG S SOFTWARE DEVELOPER IN HCL TECHNOLIGES, AND I HAVE WORKED AS TOTUR FOR ONE YEAR AFTER COMPLETION OF MY B.TECH IN BOTH CHEGG AND BARTEBLY SIR.
0 Reviews
10+ Question Solved
Related Book For 

Question Posted:
